
Posts, updates and videos about copper – updated automatically.
Interview with Graeme O’Neill, Bayhorse CEO
The opportunity to interview Bayhorse (BHS.V) CEO, Graeme O’Neill popped up. Yes, I just wrote about BHS, but chatting with the man himself was irresistible.
O’Neill has travelled to the Bayhorse Mine to oversee the mobilization of an IP survey of Bayhorse’s Idaho property (and a section of the BHS property in Oregon). But there is far more going on than that.
“I very much wanted to check on the state of the mine and the mill,” said O’Neill. “Which created the opportunity to have our new director, Christos Doulis, get up to speed on the mine and the mill. Great guy with a lot of smart questions and some great ideas. He looked at everything and, for a finance guy, had a real understanding of what we’ve accomplished.”
A recent press release stated that Bayhorse was shipping samples of its flotation concentrate to Allihies Engineering for Antimony Leach Testing, something I know is a very deep interest of O’Neill’s. “The mineralization at the Bayhorse mine is primarily tetrahedrite (silver, copper, antimony zinc),” explained O’Neill. “It is what is known as “refractory” material because it has a lot of sulphur binding the metals. To liberate the metals conventionally, the sulphur has to be roasted off. It’s expensive and environmentally nasty. Not making our Mine have the low environmental impact we set out to achieve.”
“Our original plan was to ship the flotation concentrate to an overseas smelter,” explained O’Neill. “We are getting a high-value concentrate from our mill, which makes a journey across the Pacific worthwhile. Especially with $50 plus silver. But I wanted to look at alternatives. Particularly as roasting means you not only lose the sulphur, but you also lose the antimony. Which is currently selling for $8.24 a pound.”
“I was aware of the Sunshine process which, in simple terms, breaks the tetrahedrite down chemically. As I investigated that process, I came across Allihies Engineering up in Montana,” said O’Neill. “Allihies has worked with Americas Gold and Silver using its proprietary, selective industrial Alkaline Selective Leaching hydrometallurgical technology to pull the antimony from tetrahedrite from its Galena Complex in Idaho. That rock is very similar to the material from the Bayhorse Mine so I got in touch with Allihies and we’ve sent off samples.”
O’Neill is optimistic that the Allihies leaching process will work as well with the Bayhorse concentrate as it did with Americas Gold and Silver material, which is to say an extraction rate for antimony of up to 99%. The sulphur also drops out and, after leaching, you are left with easily recoverable silver, copper and zinc.
“Of course, before we sent the samples to Allihies we needed to XRF the material to get a baseline,” said O’Neill. “We hadn’t used our XRF on the flotation concentrate from the mill because we had been using what’s known as development material, which is not really representative of the material we will be mining.”
“Quite honestly, I was astounded at the XRF results (press release),” said O’Neill. “Average in the samples of 135 ounces of silver per ton. But the other metals were a surprise: 20.6% copper, 19.5% antimony, 40% zinc and 1.6% lead. Trace, but possibly recoverable, amounts of gold. Our floatation concentrate, even from development material, is packed with metal. Now we want to see what sort of recoveries are possible with the Allihies leaching. If those recoveries are solid, we’ll be looking at putting a leaching circuit into our mill in Payette.”
O’Neill has always been looking for ways to maximize the economics of the Bayhorse Mine. “The Steinert ore sorter was a critical first step,” said O’Neill. “Leaving at least 80% of the barren rock at the mine makes trucking the sorted material much less expensive. Having our own 60-70 ton per day mill means we are able to produce high value concentrate, which, when we were looking at shipping the material across the Pacific, reduced the costs and increased the value of the shipped material. But if we are able to leach the antimony, get rid of the sulphur and other deleterious materials, we should be able to recover the silver, copper and zinc directly and have direct ship material. Why throw $8.50 a pound antimony away? With our current XRF scans, that is 400 pounds a ton. You do the math.”
O’Neill is very aware of the market for Bayhorse shares. “We are going to have news right through to the Vancouver Resource Investment Conference, which Christos wants me to attend this year. Probably not a booth, but a suite or some investor events. We’ll have the preliminary results of the IP survey in the next four to six weeks. We should also have the results of the leaching trial. Then, the detailed IP results will give us a good idea of what the VTEM blobs over at the Pegasus project in Idaho are indicating. Our senior geologists, who have done the mapping and sampling over at Pegasus, are pretty sure the mineralization at the Bayhorse Mine extends across the Snake at the north end of Pegasus. More silver pearls for our string? I don’t know. Our geos think it is a very good possibility.”
I asked O’Neill about his own plans. “Immediately, up to Vancouver to meet with investors, talk to Rick Low, our Chief Financial Officer, and plan a marketing push. Then, Director Mark Abrams and I are going to the Idaho Mining Association’s Annual conference. Meet the neighbours,” said O’Neill. “And speaking of neighbours, we just found out that the land to the south east of our ground in Idaho has been staked by Kennecott Copper. A good neighbour to have.”
“More generally,” said O’Neill. “Bringing Christos onto the Board of Directors gives us depth in the Toronto financial markets which we’ve never had before. I am very much looking forward to stepping back a little from a few of my multiple roles and bringing on the “new blood” we need to get the Bayhorse mine across the finish line.”
“I’ve seen silver trade at $12 an ounce and our model at that time suggested the Bayhorse mine would be profitable. $50 silver, even with significantly higher costs, will very likely make the mine very profitable indeed,” said O’Neill. “The ore sorter, the mill and now the prospect of using leaching to produce direct ship material have all added to that bottom line. It’s been a longer journey than I had expected. Along the way we’ve expanded the potential resource at the Bayhorse mine and opened up very prospective ground in Idaho. I believe the Bayhorse is getting ready to gallop, and Pegasus is testing it’s wings.”
Bayhorse Silver: Riding the VTEM Rocket
Not quite a rocket, yet, but a year ago Bayhorse Silver (BHS.V) was very close to the end. While it had a silver mine, a mill and an ore sorter, it did not have a final permit which would allow it to actually operate its mine. In some jurisdictions, this would not have been a show stopper and the permit would arrive in short order. But the Bayhorse mine is in Oregon, a state where mining is politically unwelcome. The permit was going to take a while.
BHS CEO Graeme O’Neill scrambled to raise money, put a lot of his own money into a couple of small private placements and managed to arrange a lease for the ore sorter. It was enough to keep the company going, barely. BHS shares fell to $0.015
Then, in October 2023, Hercules Silver (BIG.V) announced that it had drilled into what it described as a “blind copper porphyry” at its property at Cuddy Mountain, 44 kilometres down the Snake River on the Idaho side. BIG went from less than $0.20 to a high of over $1.60 in a matter of weeks. It did a deal with Barrick and now has 23 million dollars to drill out its discovery.
Here is the interesting thing, the Hercules discovery is at what geos refer to as a “suture” between the Izee terrane and the Olds Ferry terrane. Its silver is found in a rhyolite structure. The blind copper porphyry looks to have been part of the geological events which created the silver in the rhyolite.
People began to talk about “closeology”. Bayhorse finds its silver in a rhyolite structure. The Bayhorse mine is at a suture of the Izee and Olds Ferry terranes. The argument from similarity can be and was made and O’Neill raised a little over 1 million dollars in a private placement.
The biggest problem Bayhorse has faced over the years is a lack of money. The million dollar private placement, powered by the Hercules discovery, solved that in the short term. For the first time in its existence, Bayhorse had the money to explore and a reason to spend that money.
The Bayhorse value proposition has always been the re-opening of a successful, past-producing, silver mine with high-grade silver, interesting copper and gold credits and a CEO who understood logistics. O’Neill would certainly look at, and sometimes option, greenfields exploration plays, that was never the company’s focus. O’Neill knew that if he could jump through the permitting hoops, the Bayhorse mine had years of unmined, high grade, silver to extract, concentrate and sell. It still does.
Hercules provided the hint. Was the geology at its Izee/Olds Ferry terrane similar to the geology surrounding Bayhorse? O’Neill had the money to start finding out.
VTEM is a helicopter flown magnetic and resistivity survey which can locate “anomalies” down several hundred meters. Bayhorse had never had the money or a reason to fly a VTEM, now it did and in early January of this year it flew both sides of the Snake River.
While BHS may have been inspired by BIG’s success downriver, its own geological team had scouted out what it believed was a substantial rhyolite structure on the Idaho side which the geos postulated was an extension of the Bayhorse mine rhyolite. That same geo team had long speculated that the Bayhorse mine itself was potentially “over” an epithermal gold/copper intrusion. A structure which would line up with the geological theory being tested at the Hercules property.
The results of the Bayhorse VTEM were outstanding. On the Oregon side, there was an area of low resistivity right under the western end of the Bayhorse mine workings. On the Idaho side, there were three areas of low resistivity and a magnetic high right where the Bayhorse geos expected the rhyolite extension to be. And that high was, in fact, higher than the high at the Bayhorse mine itself.
Here is the map of the magnetic signatures:

Here is the map of the resistivity signatures:

All of a sudden Bayhorse Silver went from a company with a plan to re-open a mine to a company which had four resistivity targets and a huge magnetic anomaly to explore.
Bayhorse has been lucky to have senior geologists advising O’Neill as he drove towards recommissioning the Bayhorse mine. That luck was extended when Spokane-based explorationist Mark Abrams was initially signed on as a consultant to finish off the final permitting process and then as a Director.
Abrams is very much the right man at the right time. He is a fully licensed geologist in both Oregon and Idaho and has conducted exploration programs for majors like Placer Dome and Agnico Eagle. He knows how to run a serious exploration program.
I was fortunate to speak to Abrams a few days ago. He was optimistic about Bayhorse’s prospects. He was also very much an explorationist. “You need boots on the ground,” he told me. “We need to be prospecting. Looking at the sediments in the catchment areas. Get into the drainages.”
“You’re putting dots on the map,” said Abrams.
Which is the great paradox O’Neill and his team are faced with. They can see the high magnetics and the low resistivity. They have targets in general. But in the real world of exploration, this is the earliest possible stage.
Right now, BHS can, and should, stick to its knitting and drill the Big Dog, the footwall and the low resistivity at the Bayhorse mine which is exactly what it is doing. It will take a while to get the surface drilling permits in Idaho. Time which can be spent profitably increasing the staked land, perhaps doing an IP survey on one of the blobs, collecting samples and surface “shows” and figuring out where best to begin drilling what may be a significant copper porphyry.
For Bayhorse shareholders the BIG news and the VTEM results have started an increase in value. From $0.015 to .08 in a couple of months. However, that is likely just the beginning. By drilling underground BHS is creating a hard news stream likely to continue well into Fall. The Idaho targets are a largely unexpected bonus.
(Disclaimer: I own shares in Bayhorse and Graeme O’Neill is a friend. I also own shares in Hercules. At the moment, BHS is not a client of Motherlodetv.net Do your own due diligence. Call Graeme.)
Denarius Metals: Gold, Silver, Polymetallics in Colombia and Spain
Denarius Metals (DSLV.V) is a vehicle for mining entrepreneur Serafino Iacono and his team as they moved on from GCM Mining as that company was absorbed by Aris Mining. A long time member of that team was Denarius CFO Mike Davies who I spoke with June 13.
“We changed the name from Denarius Silver to Denarius Metals,” said Davies. “We now have three projects, Lomero-Poyatos deposit is located in the north-east part of the Spanish/Portuguese Iberian Pyrite Belt, our recently optioned earn-in zinc project, Toral in Northern Spain and our Zancudo silver-gold project in Colombia.”
“The Colombia project is a bit of a sleeper,” said Davies. “We retained 100% of the project when IAMGOLD decided to walk away as it was not a core priority to them. It is in a historical mining area in Colombia, has a historical mine and 40,000 meters of drilling.”
“Our plan is to get the old workings back into production using a contract miner. We’re aiming for early 2024,” said Davies. “We have to update the permits and figure out who will process the material. The goal is to produce 500 tons a day, crush it and, maybe, concentrate it. The resource contains 6 gpt gold and 100 gpt silver.”
With the team’s long experience in Colombia, Davies points out that Denarius is very involved with the communities in the area. “We’re working with the communities. One thing we are doing is building a bypass road to avoid our trucks driving through towns. We’re fortunate that it is a historical mining district so we are not anticipating negative reaction from the communities.”
While Denarius’ roots are in Colombia, for juniors the world is prospective. Spain, with its rich mining history, was a natural fit because of its culture. “The Iberian Pyrite Belt is a prolific mining district,” said Davies. It has been prolific since the time of the Roman Empire when it was a source for gold, silver, copper, tin and lead. The belt remains the largest concentration of massive sulphites in the world. Denarius’ Lomero-Poyatos deposit is on the northern edge of the Belt and is nearby several, large, producing mines.
Lomero-Poyatos has been the scene of mining and exploration activity since the late 1800s. There are eight levels of, now flooded mine workings. There are also thousands of meters of drill core, some better logged than others but representing a significant knowledge base. As well, gravimetric and resistivity studies have been conducted on the property. (This is all detailed in SRK Consulting’s comprehensive NI 43-101 Technical Report Mineral Resource Estimate submitted in late 2022 and press released November 2, 2022.)
“When we became interested in Lomero-Poyatos we knew it was high grade but it was stuck in bankruptcy,” said Davies. “There was an investigation permit in place and we bought out the creditors. There was an adjacent dormant exploration permit at Palomarejo and we were also able to get a clean permit there for three years.”
With this permit and ownership, Denarius set to work on its Phase 1, 26,000 meter, 83 hole, validation and infill drilling program. “This program gave us confidence in our model,” said Davies. “The MRE confirmed at least 10.7 million tons of material. We went on to Phase 2 which was completed in February. We drilled 13,225 meters in 42 holes. We got the results in May. Higher grades.”
Commenting in the press release announcing these results, Serafino Iacono, Executive Chairman and CEO stated, “We are encouraged by the Phase 2 drill assays validating the lateral and horizontal continuity of the massive sulphide and semi-massive sulphide mineralized lenses and confirming the presence of higher-grade mineralized zones within the broader resource envelope.”
“We’ve moved on to Phase 3 drilling which comprises 4,000 meters of infill drilling and 6,000 meters of “greenfield” drilling to test for extensions of the deposit,” said Davies. “When we complete the 4,000 meter phase we’ll update the MRE and get to work pushing a Preliminary Economic Analysis (PEA) out for the project by the end of this year.”
In November 2022, Denarius announced another Spanish venture. The Toral Zn-Pb-Ag Project, Leon Province, Northern Spain is subject to an earn in agreement with Denarius which is just getting underway. “The main focus is zinc,” said Davies. “We are looking at 20 million tons of material.” It is early days at Toral for us as we get on with exploring and expanding what looks like a rich, polymetallic, potential resource.
Denarius has put a lot on its plate but its management has put their money into the project, “Management owns 23% of the company, Aris owns 17%,” said Davies, “And if you look at the insider reports, Serafino is buying in the open market for his own account.”
With a little less than 60 million shares out and a market cap of $34,790,000, Denarius is very much worth a look at its current price of $0.59.
Denarius Metals Announces Final Drill Results from Completed Phase 2 In-Fill Drilling at Its Polymetallic Lomero Project in Spain, Including 10.25 Meters Grading 0.27% Copper, 4.79% Lead, 9.82% Zinc, 161 g/t Ag and 6.82 g/t Au
Denarius Metals Corp. (TSXV: DSLV) (OTCQX: DNRSF) (“Denarius Metals” or “the Company”) announced today that it has received the final assays for 42 drill holes, mainly in-fill holes, totaling approximately 13,225 meters, from the Phase 2 surface validation and in-fill drilling program on its polymetallic Lomero Project in southern Spain. To date, Denarius Metals has completed approximately 41,850 meters of drilling in 128 drill holes, including twinning of historical drill holes. The in-fill phase, totaling 23,920 meters and representing 57% of the total drilling program, is now complete. A final 4,000 meters validation drilling campaign, designed to finish verifying the high-grade underground drill holes drilled in the 1980s by Indumetal/Billiton, is in progress. The full drilling results will be incorporated into the geological model and will be integrated in the Mineral Resource Estimate (“MRE”) update to be completed in conjunction with a preliminary economic assessment (“PEA”) in the second half of 2023.
Key takeaways from the exploration work carried out at the Lomero Project to date include:
- Phase 2 validation and in-fill drill holes completed on the central part of the deposit have mostly intersected significant copper mineralization in massive sulphides, showing better grades than the Cu average grade of the current MRE, ranging from 0.6% up to 1.86% over intervals up to 15.70 meters thick;
- Phase 2 in-fill drill holes completed on the eastern part of the deposit have intersected significant zinc and lead mineralization showing much better grades than the Zn and Pb average grades of the current MRE, ranging for Zn from 1.08% up to 11.01% over intervals up to 6.65 meters thick, and for Pb from 1.55% to 5.05% over intervals up to 6.65 meters thick. In-fill drilling has also, confirmed high zinc and gold grades over widths that widen to depth at the westernmost end of the permit. Zinc and lead mineralization is hosted primarily in the massive sulphide domain and, to a lesser extent, in the semi-massive sulphide domain;
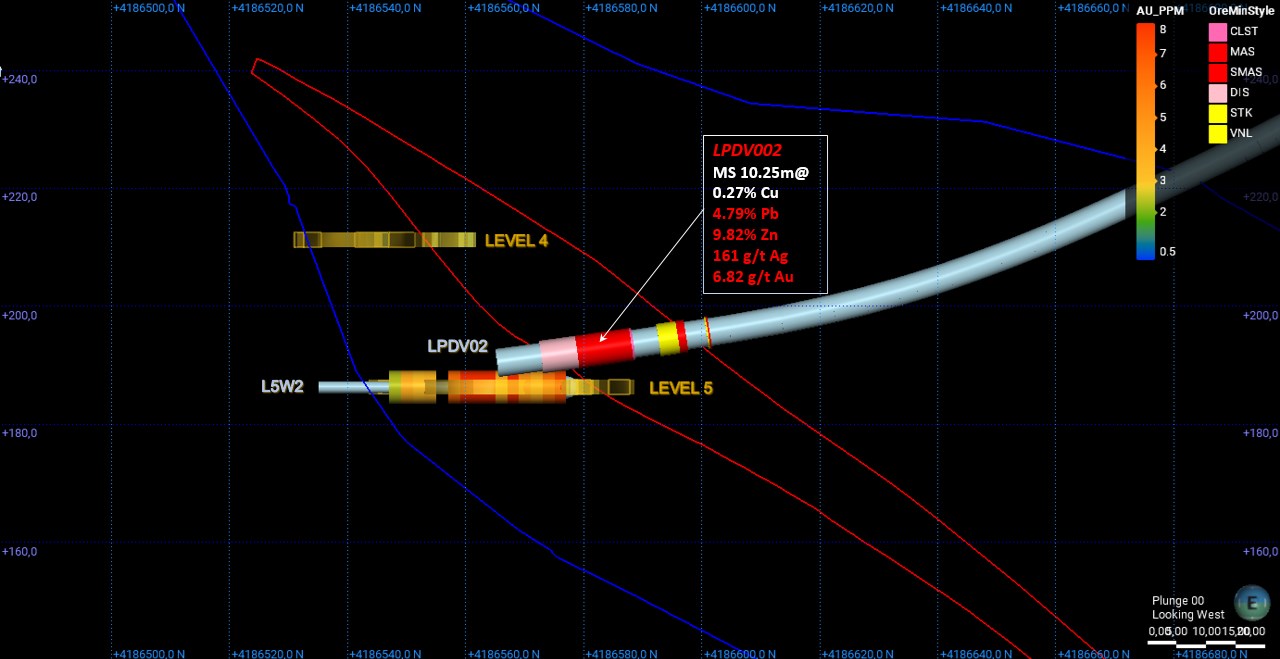
- Validation by directional drilling of the underground drilling program completed in the 1980s by Indumetal/Billiton in short < 60 m horizontal holes from underground stations was successful in returning exceptional high grades from the polymetallic mineralization hosted in the lower part of the historical mine, with drill hole LPDV002 intersecting 10.25 meters grading 0.27% copper, 4.79% lead, 9.82% zinc, 161 g/t Ag and 6.82 g/t Au;
- A PEA-level metallurgical testwork program commenced in April 2023 at Grinding Solution UK’s facilities. The testwork will be completed using two separate composites, one semi-massive sulphide and one massive sulphide, with samples collected from drill cores produced during the Company’s Phase 1 and Phase 2 drill campaigns.
Serafino Iacono, Executive Chairman and CEO of Denarius Metals, commented, “We are encouraged by the Phase 2 drill assays validating the lateral and horizontal continuity of the massive sulphide and semi-massive sulphide mineralized lenses and confirming the presence of higher-grade mineralized zones within the broader resource envelope. In addition, the initial drill assays from the validation drilling program in process are very promising and could potentially increase the grades in the current geological model. For the balance of 2023, activities at the Lomero Project will be focused on completion of the PEA, additional engineering studies to support the future development of the project and execution of the planned greenfield exploration program. The greenfield exploration program comprises 6,000 m of drilling aimed at increasing the tonnage of the MRE update based on Phase 1 and Phase 2 drilling, targeting the Las Merinas and Alianza areas located along two main shear zones discovered in 2022 by field mapping, located to the south and to the north of the shear zone that hosts the Lomero-Poyatos deposit and both of which are E-W trending.”
The Phase 2 surface validation and in-fill drilling program commenced in October 2022 and was completed in February 2023. It was designed to validate some selected historical in-fill holes drilled by Corporacion de Recursos Iberia (CRI) in 2013 within the central sector of the existing mine and then conduct 50×50 m in-fill drilling to confirm the continuity of widths and grades within the massive sulphide and semi-massive sulphide lenses to upgrade the Inferred MRE to the Indicated category. Extension drilling was also carried out in 3 holes totaling 1,815 meters aimed at testing the combined TEM and gravity anomalies that occur down-dip of the main shear-zone hosting the Lomero-Poyatos deposit.
Key Highlights
- Validation and in-fill drill holes completed on the central part of the deposit mostly showed cupriferous mineralization with maximum intersection grades of 1.86% Cu, 21 g/t Ag and 2.85 g/t Au over 6.70 meters (LM22091), 1.23% Cu, 7 g/t Ag and 1.67 g/t Au over 15.70 meters, including 1.65 meter at 1.86% Cu, 15 g/t Ag and 0.61 g/t Au (LM22085), and 1.43% Cu, 16 g/t Ag and 1.34 g/t Au over 6.30 meters (LM22084).
- In-fill drill holes completed on the eastern part of the deposit mostly showed significant zinc and lead mineralization with maximum intersection grades of 6.12% Pb, 11.01% Zn, 95 g/t Ag and 4.01 g/t Au over 2.50 meters (LM22110), 3.43% Pb, 7.54% Zn, 88 g/t Ag and 5.30 g/t Au over 2.30 meters (LM22113), and 3.68% Pb, 3.56% Zn, 127 g/t Ag and 5.62 g/t Au over 1.70 meters (LM22116). Drill hole LM23103 confirms high zinc and gold grades at depth at the westernmost end of the permit, returning 0.32% Cu, 0.95% Pb, 2.04% Zn, 37 g/t Ag and 3.79 g/t Au over 6.65 meters, including 2.15 meters at 0.40% Cu, 1.29% Pb, 2.66% Zn, 52 g/t Ag and 5.09 g/t Au, demonstrating that the deposit remains open to the west.
- Validation by directional drilling of the underground drilling program completed in the 1980’s by Indumetal/Billiton using a series of short < 60 m horizontal holes from underground stations was successful in confirming the high-grade polymetallic mineralization present in the lower part of the historical mine, with drill hole LPDV002 intersecting 10.25 meters grading 0.27% Cu, 4.79% Pb, 9.82% Zn, 161 g/t Ag and 6.82 g/t Au. Polymetallic mineralization is entirely hosted in the massive sulphide domain. Although, the same validation program failed to confirm the unusually wide historical intersections, in consensus with SRK Consulting (U.S.), Inc., the decision was made to continue the program by conventional inclined diamond drilling to speed up drilling, targeting key intersections from the historical program.
- Extension drill hole LM22115, designed to test the combined TEM and gravity anomalies that occur well below the in-fill drilling carried out so far, intersected a wide zone of thin, dense veinlets, hosted by a much wider stockwork interval, showing trace chalcopyrite and coarse pyrite mineralization filling black chlorite-altered schistosity planes, returning low-grade Au mineralization of 16.10 meters at 0.13 g/t Au. This intercept is interpreted to be of a vertically extensive stringer feeder below the massive sulphide and semi-massive sulphide lenses. Drill holes LM22121 and LM22122 didn’t return any significant Au values.
- The ongoing metallurgical test work program is testing two separate composites, one semi-massive and one massive sulphide, aimed at optimizing the base metal floatation on representative composites with the average deposit grade. The test work is expected to be completed by mid- 2023.
The following table lists the key intercepts from the Phase 2 validation and in-fill drilling program since the issuance of the current MRE with an effective date of July 19, 2022:
| Hole ID | Phase | From (m) | To (m) | Length (m) | Cu % | Pb % | Zn % | Ag g/t | Au g/t | CuEq % | Min. Type |
| LM22081 | Infill | 201.00 | 202.00 | 1.00 | 0.97 | 0.12 | 0.04 | 6 | 2.15 | 2.66 | MS |
| LM22082 | Infill | 215.80 | 223.85 | 8.05 | 1.19 | 0.23 | 0.34 | 20 | 1.02 | 2.30 | MS |
| LM22083 | Infill | 206.50 | 211.00 | 4.50 | 0.60 | 0.06 | 0.08 | 4 | 0.43 | 1.00 | MS |
| LM22084 | Infill | 161.25 | 162.70 | 1.45 | 0.30 | 0.09 | 0.11 | 22 | 3.64 | 3.27 | MS |
| “ | 169.00 | 175.30 | 6.30 | 1.43 | 0.44 | 0.47 | 16 | 1.34 | 2.83 | MS | |
| LM22085 | Infill | 222.95 | 238.65 | 15.70 | 1.23 | 0.07 | 0.05 | 7 | 1.55 | 2.48 | MS |
| “ | 246.45 | 248.10 | 1.65 | 1.86 | 0.15 | 0.17 | 15 | 0.61 | 2.55 | MS | |
| LM22086 | Infill | 224.25 | 226.50 | 2.25 | 0.27 | 0.65 | 0.10 | 33 | 3.93 | 3.70 | MS |
| “ | 226.50 | 231.50 | 5.00 | mine void fill | |||||||
| “ | 240.70 | 243.10 | 2.40 | 0.46 | 0.26 | 0.74 | 10 | 1.02 | 1.59 | MS | |
| LM22087 | Infill | 192.90 | 198.10 | 5.20 | 0.62 | 0.50 | 0.24 | 34 | 3.22 | 3.54 | MS |
| “ | 198.10 | 201.30 | 3.20 | mine void fill | |||||||
| “ | 201.30 | 204.20 | 2.90 | 0.75 | 0.06 | 0.21 | 4 | 0.33 | 1.11 | MS | |
| LM22088 | Infill | 214.70 | 216.70 | 2.00 | 1.26 | 0.18 | 0.06 | 22 | 0.84 | 2.17 | MS-SM |
| “ | 222.10 | 228.30 | 6.20 | 0.71 | 0.41 | 0.40 | 15 | 1.68 | 2.32 | SM-MS | |
| “ | 228.30 | 234.80 | 6.50 | mine void | |||||||
| LM22089 | Infill | 255.55 | 274.50 | 18.95 | 0.50 | 0.42 | 0.78 | 20 | 2.38 | 2.79 | MS-SH |
| including | 259.25 | 265.75 | 6.50 | 0.67 | 1.13 | 2.06 | 48 | 5.03 | 5.75 | MS | |
| LM22089 | 283.70 | 287.50 | 3.80 | 0.51 | 0.32 | 0.65 | 9 | 0.53 | 1.45 | MS | |
| LM22090 | Infill | 201.30 | 203.30 | 2.00 | 0.44 | 0.05 | 0.04 | 13 | 0.94 | 1.29 | MS |
| “ | 209.00 | 211.50 | 2.50 | 0.28 | 0.82 | 0.59 | 102 | 3.81 | 4.52 | MS | |
| “ | 211.50 | 213.80 | 2.30 | mine void | |||||||
| LM22091 | Infill | 236.10 | 249.10 | 13.00 | 1.20 | 0.07 | 0.06 | 12 | 1.61 | 2.55 | MS |
| including | 236.10 | 242.80 | 6.70 | 1.86 | 0.10 | 0.03 | 21 | 2.85 | 4.22 | MS | |
| LM22093 | Infill | 270.90 | 282.70 | 11.80 | 0.43 | 0.54 | 0.40 | 22 | 2.24 | 2.58 | MS-SM |
| including | 270.90 | 276.65 | 5.75 | 0.65 | 0.85 | 0.27 | 36 | 3.80 | 4.12 | MS-SM | |
| LM22095 | Infill | 279.15 | 289.30 | 10.15 | 0.64 | 0.47 | 0.97 | 29 | 3.34 | 3.80 | MS-SH |
| LM22096 | Infill | 274.40 | 281.80 | 7.40 | 0.56 | 0.63 | 2.06 | 31 | 3.59 | 4.28 | MS-SM |
| LM22097 | Infill | 222.60 | 225.85 | 3.25 | 0.15 | 0.88 | 1.63 | 25 | 0.54 | 1.49 | SM |
| LM22098 | Infill | 34.75 | 36.60 | 1.85 | 0.67 | 0.21 | 0.17 | 14 | 1.12 | 1.74 | SH |
| LM22099 | Infill | 205.90 | 207.40 | 1.50 | mine void | ||||||
| “ | 207.40 | 209.30 | 1.90 | 0.48 | 0.33 | 0.75 | 14 | 2.41 | 2.72 | MS | |
| LM22100* | Infill | 75.30 | 78.30 | 3.00 | 0.12 | 0.18 | 0.23 | 9 | 1.24 | 1.03 | SM-LH |
| “ | 78.30 | 81.20 | 2.90 | mine void | |||||||
| LM22103 | Infill | 249.55 | 256.20 | 6.65 | 0.32 | 0.95 | 2.04 | 37 | 3.79 | 4.32 | MS |
| including | 249.55 | 251.70 | 2.15 | 0.40 | 1.29 | 2.66 | 52 | 5.09 | 5.77 | MS | |
| LM22104 | Infill | 309.20 | 310.80 | 1.60 | 0.05 | 0.36 | 0.57 | 13 | 0.84 | 1.06 | STKW |
| LM22105 | Infill | 343.70 | 345.70 | 2.00 | 0.63 | 0.23 | 0.64 | 9 | 0.56 | 1.38 | MS |
| LM22109 | Infill | 162.15 | 168.80 | 6.65 | 1.55 | 1.55 | 1.08 | 49 | 2.83 | 4.84 | MS |
| LM22110 | Infill | 158.80 | 159.60 | 0.80 | 0.61 | 5.05 | 10.15 | 104 | 2.72 | 7.83 | SH |
| “ | Infill | 166.30 | 168.80 | 2.50 | 0.26 | 6.12 | 11.01 | 95 | 4.01 | 8.86 | MS |
| LM22112 | Infill | 173.10 | 175.00 | 1.90 | 0.23 | 0.50 | 2.01 | 14 | 2.41 | 2.84 | MS-DISS |
| LM22113 | Infill | 108.90 | 111.20 | 2.30 | 0.28 | 3.43 | 7.54 | 88 | 5.30 | 8.10 | MS |
| LM22116 | Infill | 62.10 | 66.20 | 4.10 | 0.16 | 1.62 | 1.54 | 59 | 3.04 | 3.86 | SH-MS |
| including | 64.50 | 66.20 | 1.70 | 0.29 | 3.68 | 3.56 | 127 | 5.62 | 7.69 | MS | |
| LM22119 | Infill | 263.00 | 264.00 | 1.00 | 0.56 | 0.15 | 0.84 | 12 | 0.73 | 1.50 | SM |
| LM22120 | Infill | 221.45 | 225.90 | 4.45 | 0.30 | 1.20 | 1.69 | 58 | 5.58 | 5.80 | MS |
| “ | 238.30 | 240.30 | 2.00 | 0.14 | 2.26 | 3.63 | 18 | 0.15 | 2.03 | STKW | |
| LPDV002 | Validation | 276.30 | 286.55 | 10.25 | 0.27 | 4.79 | 9.82 | 161 | 6.82 | 10.96 | MS |
| including | 277.30 | 281.90 | 4.60 | 0.32 | 4.61 | 9.25 | 176 | 9.66 | 13.04 | MS | |
Notes:
(1) The holes were drilled at -45 to -80 degrees from the horizontal. Grades are for semi-massive sulphide to massive sulfide intersections and some stockwork and shear zones. Sample interval grades over CuEq >1% are reported. The width is the sample length and is not necessarily the true width of the intersection. All base and precious metal grades are uncut and are not diluted to a minimum mining width.
(2) The following holes returned intervals grading <1% CuEq and so are not listed in the table: LM22092, LM22094, LM22101, LM22102, LM22106, LM22107; LM22108, LM22111, LM22114, LM22115, LM22117, LM22118, LM22121 and LPDV003.
(3) Equivalent copper grade (CuEq%) was calculated using prices of US$1,800/oz gold, US$25/oz silver, US$3.55/lb copper, US$1.00/lb zinc and US$0.90/lb lead. No adjustments were made for recovery as the project is at an exploration stage and metallurgical data to allow for estimation of recoveries is not yet available.
(4) MS: massive sulfides; SM: semi-massive sulfides; STKW: stockwork; DISS: disseminated; SH: shear-zone.
(5) LM22100 partial reassays by ALS are pending (see QAQC below).
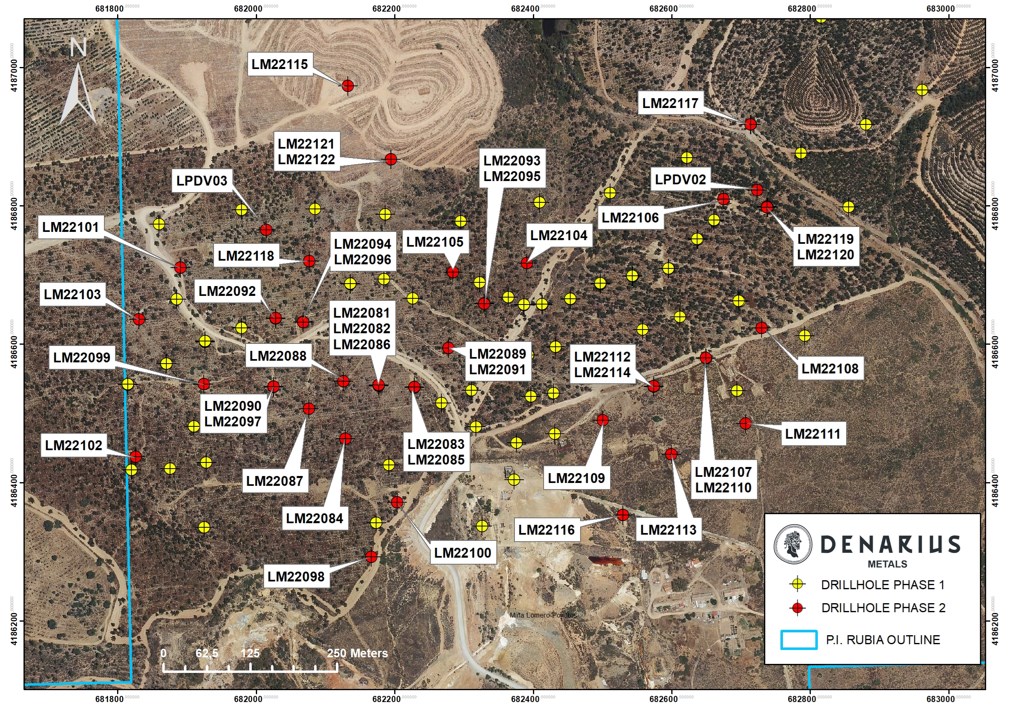
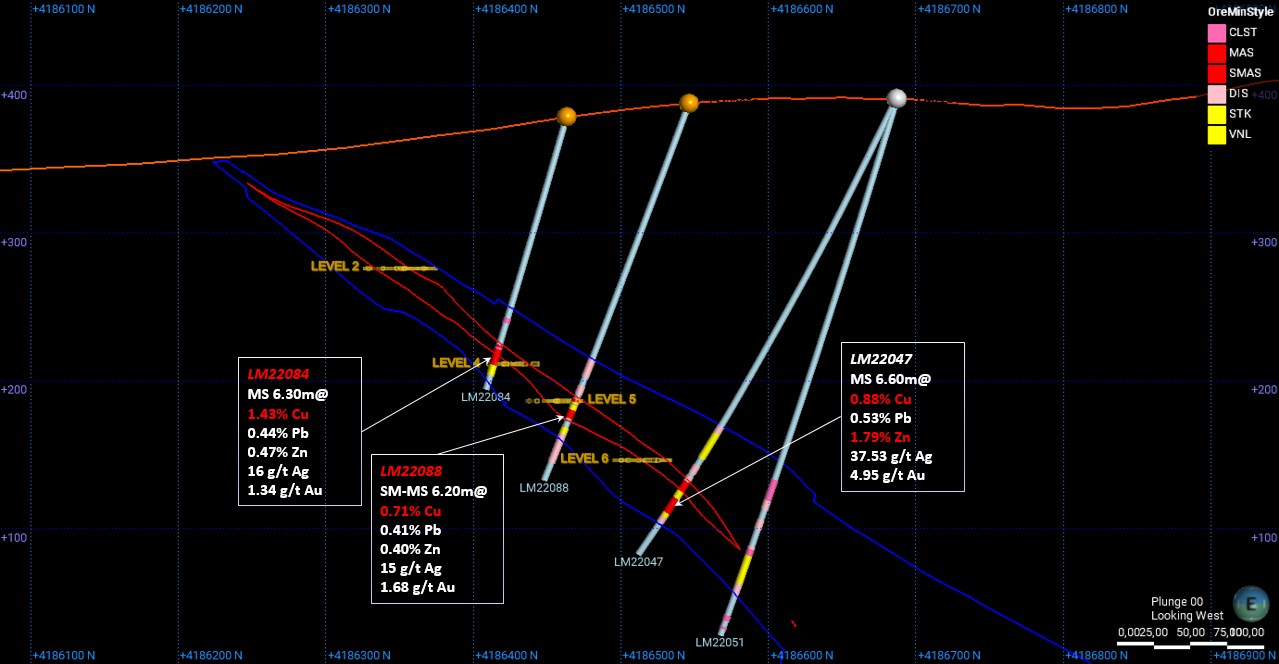
Please refer to the attached illustrative images (Attachments 1 to 7) showing (i) the location of drill holes, (ii) the location of the best copper, lead and zinc drill holes and (iii) five cross sections for drill holes LM22084, LM22088, LM22120, LPDV002, LM22115.
Qualified Persons Review
Dr. Stewart D. Redwood, PhD, FIMMM, FGS, Senior Consulting Geologist to the Company, is a qualified person as defined by National Instrument 43-101 – Standards of Disclosure or Mineral Projects and prepared or reviewed the preparation of the scientific and technical information in this press release. Verification included a review of the quality assurance and quality control samples, and review of the applicable assay databases and assay certificates.
Quality Assurance and Quality Control
The Lomero-Poyatos samples were prepared by ALS Labs (ISO/IEC 17025:2017 and ISO 9001:2015) at their facilities in Seville, Spain and assayed in Clonmel, Ireland. Gold was assayed by 30 g fire assay with AAS finish, while silver and base metals were analyzed in a multi element analysis of base metal ores and mill products by strong oxidizing digestion and ICP-AES finish. Blank, standard and duplicate samples were routinely inserted and monitored for quality assurance and quality control.
As part of its Quality Assurance and Quality Control procedures, Denarius Metals sent 331 pulps and coarse rejects at the end of Phase 2 of drilling to ALS Labs for umpire analysis to check the results from the primary laboratory, AGQ. The results from ALS showed excellent correlation for all elements for Phase 1 drilling. However, certain deviations were observed for the Phase 2 drilling results, in particular for gold fire assay and lead. Following a thorough review of internal laboratory QA/QC procedures, and confirmation assays received from a third laboratory, SGS in Huelva, Spain, the Company decided to send 100% of sample pulps from the massive and semi massive sulphide zones, plus 50% of the stockwork zones, from the Phase 2 drilling to ALS for check assays. In addition, 20% of massive sulphide samples, 10% of semi-massive sulphide samples, and 5% of stockwork samples from Phase 1 of drilling were sent to ALS for check assays. A total of 514 samples were sent to ALS for check assays.
The check assays received from ALS confirmed that Phase 1 results, as reported by the Company, are reliable. However, the check assays confirmed that there is a bias in the Phase 2 assays of the primary laboratory for gold and lead. Therefore, the AGQ results for Phase 2 were discarded and it was decided only to use results from ALS for Phase 2 drilling. The remainder of the Phase 2 stockwork zone samples are currently being reassayed by ALS for completeness. This affects one significant intersection in hole LM22100 which is reported in the table above as pending reassay results. However, given the low-grade nature of the stockwork mineralization, it is not anticipated the results will demonstrate any material differences. In addition, ALS has been designated as the primary laboratory for all future assays.
About Denarius Metals
Denarius Metals is a Canadian junior company engaged in the acquisition, exploration, development and eventual operation of polymetallic mining projects in high-grade districts, with its principal focus on the Lomero Project in Spain. The Company signed a definitive option agreement with Europa Metals Ltd. in November 2022 pursuant to which Europa has granted Denarius Metals two options to acquire up to an 80% ownership interest in the Toral Zn-Pb-Ag Project, Leon Province, Northern Spain. The Company’s 100%-owned Zancudo Project in Colombia provides an opportunity to develop near-term production and cash flow through local contract miners and long-term growth through exploration.
Additional information on Denarius Metals can be found on its website at www.denariusmetals.com and by reviewing its profile on SEDAR at www.sedar.com.
Cautionary Statement on Forward-Looking Information
Neither the TSX Venture Exchange nor its Regulation Services Provider (as that term is defined in the policies of the TSX Venture Exchange) accepts responsibility for the adequacy or accuracy of this release.
This news release contains “forward-looking information”, which may include, but is not limited to, statements with respect to anticipated business plans or strategies, including exploration programs, expected exploration results and Mineral Resource estimates. Often, but not always, forward-looking statements can be identified by the use of words such as “plans”, “expects”, “is expected”, “budget”, “scheduled”, “estimates”, “forecasts”, “intends”, “anticipates”, or “believes” or variations (including negative variations) of such words and phrases, or state that certain actions, events or results “may”, “could”, “would”, “might” or “will” be taken, occur or be achieved. Forward-looking statements involve known and unknown risks, uncertainties and other factors which may cause the actual results, performance or achievements of Denarius Metals to be materially different from any future results, performance or achievements expressed or implied by the forward-looking statements. Factors that could cause actual results to differ materially from those anticipated in these forward-looking statements are described under the caption “Risk Factors” in the Company’s Annual Information Form dated April 21, 2023 which is available for view on SEDAR at www.sedar.com. Forward-looking statements contained herein are made as of the date of this press release and Denarius Metals disclaims, other than as required by law, any obligation to update any forward-looking statements whether as a result of new information, results, future events, circumstances, or if management’s estimates or opinions should change, or otherwise. There can be no assurance that forward-looking statements will prove to be accurate, as actual results and future events could differ materially from those anticipated in such statements. Accordingly, the reader is cautioned not to place undue reliance on forward-looking statements.
For Further Information, Contact:
Michael Davies
Chief Financial Officer
(416) 360-4653
investors@denariusmetals.com

Attachment 1 – Location of drill holes reported in this press release (numbered holes).
To view an enhanced version of this graphic, please visit:
https://images.newsfilecorp.com/files/9396/167847_ee516ed5e4f18b10_001full.jpg

Attachment 2 – Location of drill holes showing Cu and Pb/Zn enrichment of the deposit.
To view an enhanced version of this graphic, please visit:
https://images.newsfilecorp.com/files/9396/167847_ee516ed5e4f18b10_002full.jpg

Attachment 3 – Cross section for drill holes LM22084 and LM22088 showing significant Cu mineralization.
To view an enhanced version of this graphic, please visit:
https://images.newsfilecorp.com/files/9396/167847_ee516ed5e4f18b10_003full.jpg

Attachment 4 – Cross section for drill holes LPDV002 and LM22120 showing high Pb/Zn grades associated to high Au grades.
To view an enhanced version of this graphic, please visit:
https://images.newsfilecorp.com/files/9396/167847_ee516ed5e4f18b10_004full.jpg

Attachment 5 – Cross section for drill hole LM22103 showing high Zn and Au grades at westernmost end of the permit.
To view an enhanced version of this graphic, please visit:
https://images.newsfilecorp.com/files/9396/167847_ee516ed5e4f18b10_005full.jpg

Attachment 6 – Cross section for drill hole LPDV002 validating Indumetal/Billiton drill hole L5W2 exceptional high grades.
To view an enhanced version of this graphic, please visit:
https://images.newsfilecorp.com/files/9396/167847_ee516ed5e4f18b10_006full.jpg

Attachment 7 – Geophysical cross section for drill hole LM22115 showing TEM conductivity (bottom) and gravity profile (top). Hole LM22115 tested a thick zone of conductivity which is interpreted to be a stockwork feeder zone.
Clean Air Metals Announces the New SLR Mineral Resource Estimate for the Thunder Bay North Critical Metals Project with an Indicated Resource of 14.0 million tonnes containing 1.2 million ounces of 2PGE (Pt+Pd) 57,500 tonnes of Cu and 34,300 tonnes of Ni
Clean Air Metals Inc. (“Clean Air Metals” or the “Company“) (TSXV: AIR) (OTCQB: CLRMF) (FRA: CKU) is pleased to announce that further to its disclosure of February 15, 2023, the Company has completed an updated Indicated and Inferred Mineral Resource estimate disclosed in accordance with National Instrument 43-101 (“NI 43-101″) for the Company’s 100%-owned Thunder Bay North Critical Metals Project (the “Project“).
The New Mineral Resource Estimate was prepared by SLR Consulting Ltd. (“SLR”) and is based on an underground constrained resource model using a Net Smelter Return (NSR) cut-off value of US$48/tonne and consensus metal pricing (Table 3). An NI 43-101 technical report will be filed on SEDAR within 45 days of the date of this news release.
The Current Deposit contains an Indicated Mineral Resource of 8.2 million tonnes grading 2.7 g/t 2PGE (“Pt + Pd”), 0.33% copper and 0.22% nickel and an Inferred Mineral Resource of 1.6 million tonnes grading 1.7 g/tonne 2PGE, 0.32% copper, 0.20% nickel (See Table 1; Figure 1).
The Escape Deposit contains an Indicated Mineral Resource of 5.8 million tonnes grading 2.6 g/t 2PGE, 0.52% copper, 0.28% nickel and an Inferred Mineral Resource of 0.6 million tonnes grading 1.5 g/tonne 2PGE, 0.29% copper, 0.17% nickel (See Table 1; Figure 1).
Thunder Bay North Critical Mineral Project Highlights
- Contained metal Indicated mineral resource at the Current Deposit is 717,000 oz 2PGE, 27,000 tonnes copper, 17,700 tonnes nickel.
- Contained metal Indicated mineral resource at the Escape Deposit is 492,000 oz 2PGE, 30,400 tonnes copper, 16,500 tonnes nickel.
- The underground Mineral Resources at the Current and Escape Deposits will now be the focus of a renewed economic study which will include specific work completed on mining run rate, optimal sequencing of the two adjacent deposits, geotechnical analysis by Carlisle Mine Geotech and updated metallurgical recoveries.
- Bench scale metallurgical testing and recovery estimates are being completed to a pre-feasibility standard by DRA Americas and will be reported in due course.
- Rhodium and cobalt are not considered payables but are potentially valuable by-product credits in the metals mix at Thunder Bay North Project.
- The Current and Escape Deposits exhibit a roughly 1:1 platinum to palladium ratio and comparable geological attributes and metal grades.
Table 1: Thunder Bay North Project – Grade Summary | |||||||||
CLASS | Density | Tonnes | Pt | Pd | Au | Ag | Cu | Ni | 2PGE8 |
Deposit | t/m³ | ktonnes | g/t | g/t | g/t | g/t | % | % | g/t |
Current | |||||||||
Indicated | 2.94 | 8,223 | 1.4 | 1.31 | 0.09 | 1.98 | 0.33 | 0.22 | 2.7 |
Inferred | 2.95 | 1,641 | 0.87 | 0.79 | 0.07 | 1.91 | 0.32 | 0.2 | 1.7 |
Escape | |||||||||
Indicated | 3.11 | 5,810 | 1.17 | 1.46 | 0.11 | 3.32 | 0.52 | 0.28 | 2.6 |
Inferred | 3.01 | 631 | 0.67 | 0.80 | 0.06 | 1.67 | 0.29 | 0.17 | 1.5 |
Total | |||||||||
Indicated | 14,033 | 1.31 | 1.37 | 0.10 | 2.53 | 0.41 | 0.25 | 2.7 | |
Inferred | 2,272 | 0.81 | 0.79 | 0.07 | 1.84 | 0.31 | 0.19 | 1.6 | |
Table 2: Thunder Bay North Project – Contained Metal | |||||||||
CLASS | Density | Tonnes | Pt | Pd | Au | Ag | Cu | Ni | 2PGE8 |
Deposit | t/m³ | ktonnes | koz | koz | koz | koz | ktonnes | ktonnes | koz |
Current Deposit | |||||||||
Indicated | 2.94 | 8,223 | 370.9 | 346.4 | 23.5 | 522.9 | 27.0 | 17.7 | 717.3 |
Inferred | 2.95 | 1,641 | 45.8 | 41.9 | 3.7 | 100.9 | 5.3 | 3.2 | 87.7 |
Escape Deposit | |||||||||
Indicated | 3.11 | 5,810 | 218.8 | 273.3 | 20.8 | 620.0 | 30.4 | 16.5 | 492.1 |
Inferred | 3.01 | 631 | 13.5 | 16.2 | 1.2 | 34.0 | 1.8 | 1.1 | 29.7 |
Total | |||||||||
Indicated | 14,033 | 589.7 | 619.7 | 44.3 | 1,142.9 | 57.5 | 34.3 | 1,209.4 | |
Inferred | 2,272 | 59.4 | 58.0 | 4.8 | 134.8 | 7.1 | 4.3 | 117.4 | |
Table 1 and Table 2 Notes: | |||
1. | CIM (2014) definitions were followed for Mineral Resources. | ||
2. | The Mineral Resources have been reported within underground reporting shapes generated using Deswik Stope Optimizer (DSO) using an NSR cut-off value of US$48/tonne. | ||
3. | Material below lakes and within 20 m of the bottom of the overburden has been excluded from the Mineral Resource statement. | ||
4. | The NSR used for reporting is based on the following: | ||
a. | Long term metal prices of US$1,500/oz Pd, US$1,450/oz Pt, US$1,800/oz Au, US$24/oz Ag, US$4.25/lb Cu, US$10/lb Ni. | ||
b. | Net metallurgical recoveries of 86% Pd, 82% Pt, 50% Au, 40% Ag, 83% Cu, and 46% Ni. | ||
5. | Bulk densities were interpolated into blocks and averages range between 2.94 t/m3 and 3.11 t/m3. | ||
6. | Numbers may not add up due to rounding. | ||
7. | Mineral Resources that are not Mineral Reserves do not have demonstrated economic viability. | ||
8. | 2PGE = Pt + Pd | ||
Figure 1. Drill-indicated oblique view of the Current and Escape deposits as defined by wireframes of mineralized zones
Triple Flag Precious Metals
The Company is pleased to report that Triple Flag Precious Metals Corp. has now forwarded the Tranche 2 payment of C$5 million pursuant to the royalty facility of the Thunder Bay North Project, previously reported (Press release December 19, 2022).
Abraham Drost, CEO stated: “The new combined Mineral Resource Estimate (“MRE”) for the Escape and Current deposits comprising the Thunder Bay North Critical Metals Project is now complete. Work will continue to determine viability of a potentially bulk mineable, ramp accessible underground constrained mineral resource. Run rates, production sequencing and preliminary economics of the new MRE are presently being scoped internally in preparation to continue technical studies. The Inferred mineralization suggests that the Current and Escape deposits are open and that the underexplored remainder of the two host magma conduits have the potential to add additional mineral resources.
The Thunder Bay North Critical Metals Project is a potential domestic North American source of platinum, palladium, copper and nickel. Federal and provincial governments have placed a strong focus on bolstering the domestic critical mineral supply chain in North America. We are very pleased that Triple Flag Precious Metals has completed Tranche 2 of a previously announced royalty financing to facilitate potential development, together with our Indigenous partners, of a sustainable critical metals mining project at Thunder Bay North.”
2023 Exploration Update
A total of 73,990 m in 171 holes were drilled by the Company from 2020-2023 for a total drilling database of 105,086 m in 266 holes which support the new Mineral Resource Estimate at the Escape Deposit.
Similarly, a total of 17,172 m in 78 holes were drilled by the Company from 2020-2023 for a total drilling database of 179,630 m in 818 holes drilled variously in 2006 – 2015 and 2020 -2023 which support the new Mineral Resource Estimate at the Current Deposit.
Mineral Resource Estimate
Block models for the Current and Escape Deposits were created by SLR using Seequent’s Leapfrog Geo and Edge using drilling and assays results as of April, 2023. Wireframes for the ultramafic chonolith were generated based on logged lithologies and chromium assays. Higher grade mineralization wireframes were generated at a 1.0 g/t Pt + Pd cut-off grade with lower grades included to maintain continuity. Assays were composited to 2 m lengths and were used for block estimation on an uncapped basis. Pt, Pd, Au, Ag, Cu, Ni and density were interpolated using Ordinary Kriging (OK) into blocks measuring 5.0 m by 5.0 m by 2.5 m. Inverse Distance Squared (ID2) and Nearest Neighbour estimates were run for validation purposes. Blocks were classified following CIM Definitions (2014) as Indicated and Inferred using drill hole spacing based criterion. Indicated Mineral Resources were based on a nominal drill hole spacing of 50 m. Mineral Resources have been reported within underground reporting shapes based on an NSR cut-off value of US$48/tonne. A crown pillar exclusion of 20 m from the bottom of the overburden below lakes and the underground reporting shapes used during reporting ensure that the Mineral Resources meet the minimum requirements for Reasonable Prospects of Eventual Economic Extraction (RPEEE).
NSR and Mineral Resources Cut-off Value
NSR values have been estimated for an operating scenario that includes production of a split copper sulphide concentrate and a nickel-rich residual sulphide concentrate, each containing payable platinum and palladium, for both the Escape and Current deposits.
Metal prices are based on consensus, long term forecasts from banks, financial institutions, and other sources. The metal prices and other input parameters used in development of a unit NSR value for each block is provided in Table 3.
Table 3: NSR Parameters | |||||||
Commodity | Units | Metal | Net | Refining Cost | Transport Cost/wmt | Treatment Cost/dmt | Royalty |
Palladium | per oz | $1,500 | 86 % | $15.00 | US$100/US$100 | US$67.33/US$150 | 3.50 % |
Platinum | per oz | $1,450 | 82 % | $15.00 | |||
Silver | per oz | $24.00 | 40 % | $0.45 | |||
Gold | per oz | $1,800 | 50 % | $4.50 | |||
Copper | per lbs | $4.25 | 83 % | $0.07 | |||
Nickel | per lbs | $10 | 46 % | $0.00 | |||
For the purpose of Mineral Resource reporting, underground constraining shapes were developed using the Deswik Stope Optimizer (DSO) based on an NSR cut-off value of US$48/tonne. The cut-off parameters, based on previous study work, are provided in Table 4:
Table 4: Cut-off Parameters | ||
Parameter | Unit | Value |
Mining (Underground) | US$/t milled | $26.92 |
Processing | US$/t milled | $15.38 |
G&A | US$/t milled | $5.38 |
Total Unit Operating Cost | US$/t milled | $47.69 |
Previous Disclosure
In its press release of February 15th 2023, the Company disclosed that initial work on an updated mineral resource estimate indicated the potential for a material reduction in the total metals content of the Current deposit in the range of 20-50%. The Company confirms that on a comparative basis, under the new Mineral Resource Estimate, the Current Deposit is approximately 33% lower in Indicated Pt + Pd Contained Metal and 21% lower in Indicated Cu Contained Metal. Management has begun the process of evaluating the potential options and viability for development of the Thunder Bay North project based on the new mineral resource.
Qualified Persons
The Mineral Resource estimate was prepared by, Sean Horan, P.Geo. (Ontario) and Tudorel Ciuculescu, P.Geo. (Ontario), of SLR Consulting Ltd., independent “Qualified Persons” under National Instrument 43-101- Standards of Disclosure for Mineral Projects. Verification included a site visit to inspect drilling, logging, density measurement procedures and sampling procedures, and a review of the control sample results used to assess laboratory assay quality. In addition, a random selection of the drill hole database results was compared with original records.
Clean Air Metals’ flagship asset is the 100% owned, high grade Thunder Bay North Project, a platinum, palladium, copper, nickel project located near the City of Thunder Bay, Ontario and the Lac des Iles Mine owned by Impala Platinum. The Thunder Bay North Project hosts the twin magma conduit bodies which host the Current and Escape deposits forming the basis for the mineral resource estimate reported herein.
Executive Chair Jim Gallagher, P.Eng. and COO Mike Garbutt, P.Eng. lead an experienced technical team studying the economics of a sustainable mining operation at Thunder Bay North. As the former CEO of North American Palladium Ltd. which owned the Lac des Iles Mine prior to the sale to Impala Platinum in December 2019, Jim Gallagher and team are credited with the mine turnaround and creation of significant value for shareholders
Social Engagement
Clean Air Metals Inc. and its wholly-owned subsidiary Panoramic PGMs (Canada) Ltd. acknowledge that the Thunder Bay North Critical Metals Project is on the traditional territories of the Fort William First Nation, Red Rock Indian Band and Biinjitiwabik Zaaging Anishinabek. The parties together are the Cooperating Participants in a Memorandum of Agreement dated January 9, 2021 (press release January 11, 2021) and Exploration Agreement signed April 13, 2022 (press release April 14, 2022).
The Company appreciates the opportunity to work in these territories and remains committed to the recognition and respect of those who have lived, traveled, and gathered on the lands since time immemorial. Clean Air Metals is committed to stewarding Indigenous heritage and remains committed to building, fostering and encouraging a respectful relationship with First Nations and Métis peoples based upon principles of mutual trust, respect, reciprocity and collaboration in the spirit of reconciliation.
Investor Relations
The Company is pleased to announce the engagement of Harbor Access in the capacity of investor relations service provider effective immediately. Harbor Access is a full-service and strategic investor relations advisory firm with offices in Stamford, Connecticut and Toronto, Ontario, Canada. Under the terms of the agreement, Harbor Access will be paid a retainer of US$8,500/month. Harbor Access has no interest, directly or indirectly, in the Company or its securities, or any right or intent to acquire such an interest.
ON BEHALF OF THE BOARD OF DIRECTORS
“Abraham Drost”
Abraham Drost, Chief Executive Officer of Clean Air Metals Inc.
Neither the TSX Venture Exchange nor its Regulation Services Provider (as that term is defined in policies of the TSX Venture Exchange) accepts responsibility for the adequacy or accuracy of this release.
The information contained herein contains “forward-looking statements” within the meaning of applicable securities legislation, including statements regarding the potential of the Thunder Bay North Critical Metals Project and the Escape and Current deposits and timing of technical studies and mineral resource estimates. Forward-looking statements relate to information that is based on assumptions of management, forecasts of future results, and estimates of amounts not yet determinable. Any statements that express predictions, expectations, beliefs, plans, projections, objectives, assumptions or future events or performance are not statements of historical fact and may be “forward-looking statements.” Forward-looking statements are subject to a variety of risks and uncertainties which could cause actual events or results to differ from those reflected in the forward-looking statements, including, without limitation: political and regulatory risks associated with mining and exploration; risks related to the maintenance of stock exchange listings; risks related to environmental regulation and liability; the potential for delays in exploration or development activities or the completion of feasibility studies; the uncertainty of profitability; risks and uncertainties relating to the interpretation of drill results, the geology, grade and continuity of mineral deposits; risks related to the inherent uncertainty of production and cost estimates and the potential for unexpected costs and expenses; results of prefeasibility and feasibility studies, and the possibility that future exploration, development or mining results will not be consistent with the Company’s expectations; risks related to commodity price fluctuations; and other risks and uncertainties related to the Company’s prospects, properties and business detailed elsewhere in the Company’s disclosure record. Should one or more of these risks and uncertainties materialize, or should underlying assumptions prove incorrect, actual results may vary materially from those described in forward-looking statements. Investors are cautioned against attributing undue certainty to forward-looking statements. These forward-looking statements are made as of the date hereof and the Company does not assume any obligation to update or revise them to reflect new events or circumstances, except in accordance with applicable securities laws. Actual events or results could differ materially from the Company’s expectation or projection.
SOURCE Clean Air Metals Inc.

For further information: Abraham Drost, Chief Executive Officer of Clean Air Metals Inc., Phone: 807-252-7800, Email: adrost@cleanairmetals.ca, Web: www.cleanairmetals.ca
Eloro Resources’ drill hole DSB-47 intersects 114g Ag eq/t (9.90g Ag/t, 0.12 g Au/t, 0.96% Zn, and 0.68% Pb) over 320.97m in the Santa Barbara High-Grade Zone, at the Iska Iska Silver-Tin Polymetallic Project, Potosi Department, Bolivia
Eloro Resources Ltd. (TSX: ELO; OTCQX: ELRRF; FSE: P2QM) (“Eloro”, or the “Company”) is pleased to announce assay results from the last eight (8) diamond drill holes from the definition drill program at Santa Barbara in the Iska Iska silver-tin polymetallic project in the Potosi Department, southern Bolivia. Two (2) of these drill holes (DSB-45 and DSB-47) filled in gaps in previous drilling of the High-Grade Zone. The remaining six (6) holes (DSB-44. DSB-48, DSB-49, DSB-50, DSB-51 and DSB-52) tested the potential south-southeastern extension of the High-Grade Zone at Santa Barbara.
As previously reported in Eloro’s press release dated November 27, 2022, the Company completed 84,495m of drilling in 122 holes to complete the definition drill program in the Santa Barbara target area, as shown in Figure 1. Tables 1 and 2 list significant assay results for the reported drill holes. Prices used for calculating Ag equivalent grades are as outlined in Eloro’s July 21, 2022 press release to maintain consistency with Ag equivalent calculations in previous releases.
Tom Larsen, CEO of Eloro, said: “These latest results, which complete the Santa Barbara definition diamond drill program, have significantly expanded the potential open pittable resource across the valley of the Iska Iska Caldera. Micon International Limited (”Micon”) will be updating the deposit’s inaugural mineral resource model to incorporate these new results. Our geological technical team led by Dr. Bill Pearson, P.Geo. and Dr. Osvaldo Arce, P.Geo., is working closely with Micon to ensure all required information is completed. As recently reported (see Eloro’s press release dated April 4, 2023) additional metallurgical testing is being carried out under the direction of Mike Hallewell, C.Eng., Eloro’s Senior Strategic Metallurgist.”
Dr. Bill Pearson, P.Geo., Eloro’s Executive Vice President, Exploration commented: “Drilling is advancing in the Casiterita area as previously outlined to test for the potential tin porphyry (see Eloro’s February 14, 2023 press release). To date, a total of 3,302 metres of diamond drilling has been completed in 9 holes, including two in progress. Assay results from these holes are pending. We have also completed additional surface induced polarization/resistivity (“IP/Res”) surveys on the western side of Santa Barbara. Bore hole IP/Res (“BHIP”) surveys continue to be carried out on drill holes as holes are completed. Regional geological, prospecting and sampling, along with ground magnetic surveys, are being carried out on Eloro’s large land package in the Iska Iska area (see Eloro press release dated November 22, 2022).”
Santa Barbara Definition Drilling
Hole DSB-47 was drilled to test the area immediately southwest of the Santa Barbara Breccia Pipe (“SBBP”) (Figure 1) and returned a 321m long intersection with a number of higher-grade intervals as follows:
- 114g Ag eq/t (9.90g Ag/t, 0.12 g Au/t, 0.96% Zn, and 0.68% Pb) over 320.97m from 59.40m to 380.37m, including higher-grade portions of:
- 232.30 g Ag eq/t (29.86g Ag/t, 0.22 g Au/t, 0.63% Zn, 2.18% Pb, 0.30% Cu and 0.10% Sn) over 32.02m from 60.90m to 92.92m
- 147.06 g Ag eq/t (5.41g Ag/t, 1.90% Zn and 0.90% Pb) over 10.66m from 133.89m to 144.55m
- 184.83 g Ag eq/t (36.83g Ag/t, 1.81% Zn and 1.13% Pb) over 23.82m from 170.30m to 194.12m
- 243.09 g Ag eq/t (4.48g Ag/t, 0.95 g Au/t, 2.02% Zn and 0.81% Pb) over 13.68m from 218.45m to 232.13m and
- 249.06g Ag eq/t (18.48g Ag/t, 0.10 g Au/t, 2.34% Zn, 1.74% Pb and 0.11% Sn) over 24.30m from 285.25m to 309.55m
Six (6) holes (DSB-44. DSB-48, DSB-49, DSB-50, DSB-51 and DSB-52) tested the potential south-southeastern extension of the High-Grade Zone at Santa Barbara. All these holes, which were drilled at an azimuth of 2250 with a dip of -600, tested and confirmed an additional 300m of potential strike length to the south-southeast. Collectively, these holes intersected many significant intersections within altered and mineralized dacite porphyry, dacite and dacitic breccia.
The most significant holes are the most southernmost three, DSB-50, DSB-51 and DSB-52, which each returned well mineralized intersections over 100m in core length as follows:
- 86.67g Ag eq/t (13.57g Ag/t, 0.99% Zn and 0.41% Pb) over 105.42m including 193.50 g Ag eq/t (15.34g Ag/t, 3.22% Zn and 0.17% Pb) over 10.57m (DSB-50)
- 103.03g Ag eq/t (5.18g Ag/t, 1.72% Zn and 0.21% Pb) over 143.06m including 175.06 g Ag eq/t (9.39g Ag/t, 2.96% Zn and 0.35% Pb) over 49.87m (DSB-51)
- 123.28g Ag eq/t (7.46g Ag/t, 0.14 g Au/t, 1.85% Zn and 0.26% Pb) over 119.77m including 306.28 g Ag eq/t (18.03g Ag/t, 0.45g Au/t, 4.55% Zn and 0.47% Pb) over 28.79m (DSB-52)
Drill holes in the south-southeastern extension of the Santa Barbara Deposit are notably Zn-rich returning some of the highest Zn values intersected thus far. These three holes expand the strike extent of the Santa Barbara High-Grade Zone to more than 1,100m significantly expanding the potential open pittable resource. The High-Grade zone is now 800m across and is open along strike to the south-southeast.
In addition to the results cited above, all six holes drilled in the southeasternmost part of the target area returned numerous additional reportable intersections which are listed in detail in Table 2.
Figure 1 – Geological Plan Map showing Drilling in Santa Barbara Area with Holes referred to in this release highlighted.
Table 1: Significant Results, Fill-in Surface Diamond Drilling Santa Barbara Deposit as at April 12, 2023.
| Hole No. | From (m) | To (m) | Length (m) | Ag | Au | Zn | Pb | Cu | Sn | Bi | Cd | Ag eq |
| g/t | g/t | % | % | % | % | % | % | g/t | ||||
| DSB-47 | 14.12 | 20.13 | 6.01 | 3.00 | 0.18 | 0.02 | 0.42 | 0.07 | 0.01 | 0.001 | 0.001 | 45.31 |
| 35.10 | 38.13 | 3.03 | 5.02 | 0.16 | 0.06 | 0.77 | 0.02 | 0.04 | 0.001 | 0.001 | 63.85 | |
| 59.40 | 380.37 | 320.97 | 9.90 | 0.12 | 0.96 | 0.68 | 0.06 | 0.04 | 0.007 | 0.006 | 114.00 | |
| Incl. | 60.90 | 92.92 | 32.02 | 29.86 | 0.22 | 0.63 | 2.18 | 0.30 | 0.10 | 0.037 | 0.008 | 232.30 |
| Incl. | 133.89 | 144.55 | 10.66 | 5.41 | 0.02 | 1.90 | 0.90 | 0.02 | 0.04 | 0.002 | 0.008 | 147.06 |
| Incl. | 170.30 | 194.12 | 23.82 | 36.83 | 0.02 | 1.81 | 1.13 | 0.02 | 0.04 | 0.007 | 0.009 | 184.83 |
| Incl. | 218.45 | 232.13 | 13.68 | 4.48 | 0.95 | 2.02 | 0.81 | 0.03 | 0.05 | 0.012 | 0.021 | 243.09 |
| Incl. | 285.25 | 309.55 | 24.30 | 18.48 | 0.10 | 2.34 | 1.74 | 0.03 | 0.11 | 0.012 | 0.011 | 249.06 |
| 407.54 | 443.53 | 35.99 | 60.46 | 0.04 | 0.17 | 0.04 | 0.03 | 0.06 | 0.016 | 0.001 | 102.52 | |
| 449.57 | 502.90 | 53.33 | 19.32 | 0.03 | 0.12 | 0.02 | 0.02 | 0.05 | 0.004 | 0.001 | 48.36 | |
| 523.78 | 544.27 | 20.49 | 46.60 | 0.33 | 0.18 | 0.03 | 0.05 | 0.06 | 0.038 | 0.001 | 122.11 | |
| 552.01 | 553.45 | 1.44 | 49.00 | 0.11 | 0.08 | 0.02 | 0.04 | 0.04 | 0.025 | 0.001 | 89.83 | |
| 558.01 | 565.49 | 7.48 | 5.57 | 0.03 | 0.11 | 0.02 | 0.02 | 0.05 | 0.010 | 0.001 | 40.35 | |
| 570.00 | 571.54 | 1.54 | 22.00 | 0.03 | 0.03 | 0.01 | 0.04 | 0.06 | 0.010 | 0.001 | 56.27 | |
| 577.49 | 579.02 | 1.53 | 65.00 | 0.53 | 0.08 | 0.14 | 0.07 | 0.15 | 0.136 | 0.001 | 217.80 | |
| 589.56 | 595.70 | 6.14 | 16.63 | 0.12 | 0.04 | 0.03 | 0.02 | 0.05 | 0.029 | 0.001 | 57.26 | |
| 602.08 | 603.62 | 1.54 | 1.00 | 0.01 | 0.05 | 0.02 | 0.00 | 0.13 | 0.001 | 0.001 | 56.14 | |
| 606.71 | 609.71 | 3.00 | 5.47 | 0.18 | 0.03 | 0.03 | 0.02 | 0.04 | 0.034 | 0.001 | 48.22 | |
| 612.72 | 615.73 | 3.01 | 0.75 | 0.01 | 0.02 | 0.01 | 0.01 | 0.11 | 0.001 | 0.001 | 45.72 | |
| 618.73 | 620.27 | 1.54 | 0.50 | 0.01 | 0.02 | 0.01 | 0.01 | 0.12 | 0.001 | 0.001 | 50.24 | |
| 626.26 | 627.77 | 1.51 | 2.00 | 0.01 | 0.01 | 0.01 | 0.01 | 0.11 | 0.001 | 0.001 | 48.49 | |
| 639.90 | 641.45 | 1.55 | 1.00 | 0.01 | 0.60 | 0.01 | 0.00 | 0.04 | 0.001 | 0.002 | 46.31 | |
| 654.89 | 656.38 | 1.49 | 7.00 | 0.16 | 0.12 | 0.01 | 0.06 | 0.08 | 0.009 | 0.001 | 66.86 | |
| 669.92 | 671.43 | 1.51 | 1.00 | 0.03 | 0.07 | 0.01 | 0.01 | 0.11 | 0.001 | 0.001 | 52.02 | |
| 701.66 | 704.66 | 3.00 | 5.93 | 0.11 | 0.26 | 0.03 | 0.03 | 0.29 | 0.005 | 0.001 | 145.91 | |
| 719.59 | 721.09 | 1.50 | 3.00 | 0.16 | 0.21 | 0.03 | 0.07 | 0.09 | 0.036 | 0.001 | 77.56 | |
| 773.78 | 778.30 | 4.52 | 1.33 | 0.13 | 0.06 | 0.05 | 0.00 | 0.08 | 0.047 | 0.001 | 60.85 | |
| 839.96 | 841.43 | 1.47 | 16.00 | 0.09 | 0.04 | 0.02 | 0.08 | 0.08 | 0.007 | 0.001 | 68.49 | |
| 853.45 | 859.50 | 6.05 | 6.95 | 0.19 | 0.19 | 0.02 | 0.04 | 0.02 | 0.012 | 0.001 | 47.65 | |
| 872.88 | 874.40 | 1.52 | 6.00 | 0.03 | 0.02 | 0.00 | 0.32 | 0.04 | 0.021 | 0.001 | 65.14 | |
| 888.02 | 892.58 | 4.56 | 5.97 | 0.22 | 0.16 | 0.02 | 0.09 | 0.02 | 0.022 | 0.001 | 58.69 | |
| 934.63 | 936.15 | 1.52 | 1.00 | 0.27 | 0.00 | 0.00 | 0.02 | 0.01 | 0.092 | 0.001 | 50.88 | |
| 966.19 | 967.73 | 1.54 | 1.00 | 0.65 | 0.01 | 0.00 | 0.01 | 0.01 | 0.002 | 0.001 | 64.93 | |
| 973.69 | 982.69 | 9.00 | 1.74 | 0.29 | 0.01 | 0.00 | 0.08 | 0.01 | 0.050 | 0.001 | 53.07 | |
Table 1 (con’t) –
| Hole No. | From (m) | To (m) | Length (m) | Ag | Au | Zn | Pb | Cu | Sn | Bi | Cd | Ag eq |
| g/t | g/t | % | % | % | % | % | % | g/t | ||||
| DSB-45 | 14.40 | 15.75 | 1.35 | 14.00 | 0.04 | 0.00 | 0.38 | 0.01 | 0.13 | 0.011 | 0.001 | 82.58 |
| 57.15 | 58.65 | 1.50 | 27.00 | 0.03 | 0.00 | 0.29 | 0.01 | 0.02 | 0.014 | 0.001 | 49.73 | |
| 69.30 | 84.57 | 15.27 | 11.72 | 0.01 | 0.00 | 0.22 | 0.01 | 0.05 | 0.003 | 0.001 | 40.33 | |
| 92.45 | 95.63 | 3.18 | 20.09 | 0.05 | 0.01 | 0.60 | 0.03 | 0.21 | 0.036 | 0.001 | 135.39 | |
| 104.68 | 124.58 | 19.90 | 24.67 | 0.06 | 0.00 | 0.21 | 0.02 | 0.03 | 0.001 | 0.001 | 48.28 | |
| 139.70 | 157.37 | 17.67 | 21.74 | 0.10 | 0.01 | 0.33 | 0.01 | 0.01 | 0.001 | 0.001 | 46.54 | |
| 161.89 | 164.98 | 3.09 | 8.49 | 0.28 | 0.00 | 0.42 | 0.01 | 0.00 | 0.001 | 0.001 | 49.54 | |
| 172.53 | 177.26 | 4.73 | 31.95 | 0.18 | 0.01 | 0.17 | 0.01 | 0.03 | 0.066 | 0.001 | 80.33 | |
| 197.00 | 206.45 | 9.45 | 18.86 | 0.04 | 0.00 | 0.04 | 0.01 | 0.05 | 0.001 | 0.001 | 43.57 | |
| 230.67 | 239.67 | 9.00 | 2.12 | 0.02 | 0.51 | 0.06 | 0.01 | 0.02 | 0.001 | 0.004 | 40.74 | |
| 280.28 | 305.84 | 25.56 | 10.17 | 0.07 | 0.02 | 0.03 | 0.08 | 0.09 | 0.008 | 0.001 | 64.68 | |
| Incl. | 298.27 | 302.82 | 4.55 | 21.75 | 0.20 | 0.03 | 0.03 | 0.27 | 0.27 | 0.037 | 0.001 | 186.19 |
| 316.46 | 339.21 | 22.75 | 30.04 | 0.01 | 0.01 | 0.01 | 0.05 | 0.06 | 0.010 | 0.001 | 62.73 | |
| 354.21 | 360.31 | 6.10 | 6.76 | 0.04 | 0.05 | 0.02 | 0.12 | 0.19 | 0.001 | 0.001 | 103.32 | |
| 413.20 | 417.70 | 4.50 | 21.33 | 0.03 | 0.03 | 0.00 | 0.06 | 0.09 | 0.005 | 0.001 | 67.39 | |
| 443.40 | 444.91 | 1.51 | 2.00 | 0.01 | 0.31 | 0.03 | 0.06 | 0.05 | 0.001 | 0.001 | 47.17 | |
| 450.90 | 455.40 | 4.50 | 10.86 | 0.03 | 0.01 | 0.01 | 0.01 | 0.13 | 0.007 | 0.001 | 69.23 | |
| 464.42 | 465.97 | 1.55 | 5.00 | 0.02 | 0.02 | 0.01 | 0.06 | 0.10 | 0.008 | 0.001 | 56.18 | |
| 506.84 | 509.86 | 3.02 | 15.00 | 0.39 | 0.20 | 0.05 | 0.29 | 0.27 | 0.003 | 0.001 | 201.22 | |
| 517.45 | 519.01 | 1.56 | 7.00 | 0.39 | 0.11 | 0.04 | 0.01 | 0.02 | 0.003 | 0.001 | 56.84 | |
| 526.47 | 531.00 | 4.53 | 7.00 | 0.17 | 0.19 | 0.05 | 0.01 | 0.03 | 0.003 | 0.001 | 47.20 | |
| 578.10 | 592.40 | 14.30 | 15.88 | 0.11 | 0.21 | 0.02 | 0.14 | 0.13 | 0.031 | 0.002 | 107.89 | |
| Incl. | 584.05 | 589.35 | 5.30 | 19.23 | 0.08 | 0.33 | 0.02 | 0.32 | 0.30 | 0.013 | 0.002 | 198.35 |
| 608.89 | 622.54 | 13.65 | 4.83 | 0.09 | 0.14 | 0.01 | 0.06 | 0.04 | 0.010 | 0.001 | 43.15 | |
| 672.53 | 674.06 | 1.53 | 11.00 | 0.13 | 0.88 | 0.04 | 0.03 | 0.03 | 0.003 | 0.005 | 82.53 | |
| 686.18 | 687.65 | 1.47 | 15.00 | 0.13 | 0.03 | 0.08 | 0.09 | 0.10 | 0.007 | 0.001 | 80.58 | |
| 693.70 | 695.20 | 1.50 | 0.50 | 0.66 | 0.03 | 0.02 | 0.04 | 0.00 | 0.001 | 0.001 | 67.92 | |
| 716.50 | 724.05 | 7.55 | 4.78 | 1.10 | 0.24 | 0.02 | 0.04 | 0.04 | 0.169 | 0.001 | 171.18 | |
| 790.55 | 799.68 | 9.13 | 7.14 | 0.06 | 0.01 | 0.01 | 0.14 | 0.12 | 0.079 | 0.001 | 90.87 | |
| 805.78 | 807.25 | 1.47 | 5.00 | 3.40 | 0.36 | 0.01 | 0.01 | 0.01 | 0.151 | 0.001 | 366.52 | |
| 817.74 | 819.26 | 1.52 | 1.00 | 1.95 | 0.04 | 0.00 | 0.02 | 0.03 | 0.091 | 0.001 | 210.52 | |
Note: True width of the mineralization is not known at the present time, but based on the current understanding of the relationship between drill orientation/inclination and the mineralization within the breccia pipes and the host rocks such as sandstones and dacites, it is estimated that true width ranges between 70% and 90% of the down hole interval length but this will be confirmed by further drilling and geological modelling.
Chemical symbols: Ag= silver, Au = gold, Zn = zinc, Pb = lead, Cu = copper, Sn = tin, Bi = bismuth, Cd = cadmium and g Ag eq/t = grams silver equivalent per tonne. Quantities are given in percent (%) for Zn, Pb Cu, Sn, Bi and Cd and in grams per tonne (g/t) for Ag, Au and Ag eq.
Metal prices and conversion factors used for calculation of g Ag eq/t (grams Ag per grams x metal ratio) are as follows: (Prices updated as of July 21, 2022, to more accurately reflect current metal prices):
| Element | Price $US (per kg) | Ratio to Ag | |
| Ag | $607.00 | 1.0000 | |
| Sn | $23.55 | 0.0589 | |
| Zn | $2.98 | 0.0046 | |
| Pb | $1.92 | 0.0032 | |
| Au | $54,932.80 | 79.7221 | |
| Cu | $7.00 | 0.0134 | |
| Bi | $12.76 | 0.0177 | |
| Cd | $5.50 | 0.0076 | |
In calculating the intersections reported in this press release a sample cutoff of 30 g Ag eq/t was used with generally a maximum dilution of 3 continuous samples below cutoff included within a mineralized section unless more dilution is justified geologically.
The equivalent grade calculations are based on the stated metal prices and are provided for comparative purposes only, due to the polymetallic nature of the deposit. Metallurgical tests are in progress by Blue Coast Research to establish levels of recovery for each element reported. The preliminary phase of Ag, Zn and Pb testwork is complete but additional development and optimization will be required. Metallurgical testing is in progress to establish Sn recovery. Future geo-metallurgical programs will also include studies to understand the deportment of other potential metals such as gold, copper, bismuth and indium. While there is no assurance that all or any of the reported concentrations of metals will be recoverable, Bolivia has a long history of successfully mining and processing similar polymetallic deposits which is well documented in the landmark volume “Yacimientos Metaliferos de Bolivia” by Dr. Osvaldo R. Arce Burgoa, P.Geo.
Table 2: Significant Results, Definition Surface Diamond Drilling South-Southeastern Extension Santa Barbara Deposit as at April 11, 2023.
| Hole No. | From (m) | To (m) | Length (m) | Ag | Au | Zn | Pb | Cu | Sn | Bi | Cd | Ag eq |
| g/t | g/t | % | % | % | % | % | % | g/t | ||||
| DSB-44 | 30.72 | 32.20 | 1.48 | 0.50 | 0.51 | 0.02 | 0.02 | 0.01 | 0.01 | 0.001 | 0.001 | 54.61 |
| 74.27 | 77.22 | 2.95 | 3.10 | 0.01 | 1.11 | 0.15 | 0.01 | 0.02 | 0.001 | 0.002 | 70.58 | |
| 116.55 | 118.02 | 1.47 | 3.00 | 0.01 | 1.24 | 0.17 | 0.01 | 0.01 | 0.001 | 0.004 | 75.40 | |
| 122.53 | 125.54 | 3.01 | 6.01 | 0.01 | 1.82 | 0.22 | 0.04 | 0.01 | 0.001 | 0.006 | 114.11 | |
| 136.08 | 137.57 | 1.49 | 7.00 | 0.02 | 1.77 | 0.48 | 0.01 | 0.00 | 0.001 | 0.005 | 113.23 | |
| 216.26 | 241.83 | 25.57 | 5.95 | 0.03 | 1.42 | 0.24 | 0.02 | 0.01 | 0.002 | 0.005 | 92.71 | |
| 256.90 | 264.36 | 7.46 | 0.89 | 0.03 | 1.99 | 0.43 | 0.01 | 0.01 | 0.001 | 0.006 | 119.73 | |
| 271.92 | 276.43 | 4.51 | 1.51 | 0.06 | 0.47 | 0.08 | 0.07 | 0.01 | 0.011 | 0.002 | 45.10 | |
| 291.52 | 300.53 | 9.01 | 5.67 | 0.04 | 1.13 | 0.27 | 0.02 | 0.01 | 0.001 | 0.004 | 78.77 | |
| 332.08 | 336.60 | 4.52 | 3.99 | 0.01 | 0.59 | 0.27 | 0.01 | 0.01 | 0.001 | 0.003 | 46.16 | |
| 347.09 | 389.20 | 42.11 | 5.85 | 0.17 | 1.10 | 0.26 | 0.02 | 0.01 | 0.005 | 0.005 | 90.53 | |
| Incl. | 380.25 | 389.20 | 8.95 | 10.59 | 0.56 | 1.67 | 0.62 | 0.03 | 0.01 | 0.020 | 0.007 | 175.29 |
| 416.30 | 425.40 | 9.10 | 5.16 | 0.02 | 0.96 | 0.12 | 0.01 | 0.01 | 0.001 | 0.004 | 63.12 | |
| 436.06 | 472.20 | 36.14 | 7.01 | 0.03 | 1.22 | 0.14 | 0.01 | 0.01 | 0.001 | 0.007 | 80.71 | |
| Incl. | 439.06 | 445.15 | 6.09 | 12.07 | 0.11 | 2.75 | 0.27 | 0.01 | 0.01 | 0.001 | 0.018 | 171.92 |
| Incl. | 464.62 | 469.13 | 4.51 | 7.53 | 0.01 | 1.45 | 0.24 | 0.02 | 0.03 | 0.001 | 0.004 | 102.66 |
| 478.46 | 487.40 | 8.94 | 8.98 | 0.08 | 0.99 | 0.16 | 0.01 | 0.01 | 0.001 | 0.005 | 76.33 | |
| 499.49 | 525.13 | 25.64 | 11.41 | 0.03 | 1.04 | 0.29 | 0.01 | 0.03 | 0.001 | 0.004 | 87.00 | |
| Incl. | 499.49 | 508.52 | 9.03 | 22.37 | 0.06 | 1.71 | 0.60 | 0.02 | 0.03 | 0.001 | 0.009 | 144.05 |
| 534.16 | 544.69 | 10.53 | 5.45 | 0.02 | 0.56 | 0.10 | 0.01 | 0.02 | 0.001 | 0.002 | 48.25 | |
| 547.80 | 567.30 | 19.50 | 6.54 | 0.12 | 0.72 | 0.07 | 0.02 | 0.04 | 0.001 | 0.003 | 72.23 | |
| 574.84 | 576.34 | 1.50 | 18.00 | 0.22 | 2.49 | 0.42 | 0.03 | 0.07 | 0.001 | 0.010 | 204.13 | |
| 583.86 | 586.82 | 2.96 | 6.52 | 0.01 | 1.21 | 0.12 | 0.01 | 0.03 | 0.001 | 0.004 | 83.80 | |
| 598.90 | 603.39 | 4.49 | 24.73 | 0.25 | 0.51 | 0.18 | 0.03 | 0.09 | 0.001 | 0.001 | 117.24 | |
| 619.93 | 630.64 | 10.71 | 12.39 | 0.12 | 0.88 | 0.03 | 0.02 | 0.03 | 0.004 | 0.001 | 80.09 | |
| 634.94 | 636.44 | 1.50 | 11.00 | 0.09 | 0.30 | 0.03 | 0.02 | 0.04 | 0.001 | 0.001 | 52.06 | |
| 706.11 | 709.22 | 3.11 | 4.68 | 0.09 | 1.57 | 0.04 | 0.02 | 0.05 | 0.001 | 0.006 | 114.27 | |
| 730.20 | 736.28 | 6.08 | 4.51 | 0.08 | 0.21 | 0.00 | 0.03 | 0.06 | 0.001 | 0.001 | 49.75 | |
| 748.30 | 769.47 | 21.17 | 7.34 | 0.04 | 0.52 | 0.02 | 0.01 | 0.03 | 0.001 | 0.002 | 50.23 | |
| 787.70 | 833.13 | 45.43 | 10.17 | 0.14 | 0.36 | 0.13 | 0.01 | 0.10 | 0.001 | 0.002 | 83.94 | |
| Incl. | 824.04 | 830.07 | 6.03 | 26.60 | 0.09 | 0.53 | 0.23 | 0.01 | 0.22 | 0.001 | 0.003 | 155.60 |
| 869.40 | 870.90 | 1.50 | 47.00 | 0.03 | 0.08 | 0.03 | 0.16 | 0.16 | 0.023 | 0.001 | 140.96 | |
| 931.33 | 932.83 | 1.50 | 2.00 | 1.57 | 0.02 | 0.01 | 0.01 | 0.00 | 0.001 | 0.001 | 147.71 | |
| 944.92 | 946.46 | 1.54 | 3.00 | 0.40 | 0.33 | 0.00 | 0.02 | 0.01 | 0.001 | 0.002 | 59.87 | |
Table 2 (con’t) –
| Hole No. | From (m) | To (m) | Length (m) | Ag | Au | Zn | Pb | Cu | Sn | Bi | Cd | Ag eq |
| g/t | g/t | % | % | % | % | % | % | g/t | ||||
| DSB-48 | 0.00 | 1.59 | 1.59 | 3.50 | 0.01 | 0.01 | 0.02 | 0.00 | 0.12 | 0.001 | 0.001 | 52.48 |
| 76.14 | 79.13 | 2.99 | 36.17 | 0.32 | 0.09 | 0.81 | 1.10 | 0.01 | 0.127 | 0.003 | 251.50 | |
| 132.07 | 133.54 | 1.47 | 1.10 | 0.50 | 0.55 | 0.07 | 0.18 | 0.00 | 0.005 | 0.001 | 98.73 | |
| 151.55 | 154.57 | 3.02 | 1.05 | 0.05 | 1.14 | 0.05 | 0.03 | 0.00 | 0.001 | 0.003 | 68.53 | |
| 210.44 | 217.93 | 7.49 | 7.88 | 0.11 | 2.38 | 0.22 | 0.21 | 0.00 | 0.001 | 0.012 | 168.86 | |
| 287.40 | 306.97 | 19.57 | 18.21 | 0.07 | 1.15 | 0.19 | 0.19 | 0.00 | 0.020 | 0.004 | 114.11 | |
| 342.90 | 345.90 | 3.00 | 8.30 | 0.05 | 1.47 | 0.21 | 0.06 | 0.00 | 0.001 | 0.005 | 99.52 | |
| 386.60 | 443.60 | 57.00 | 10.62 | 0.59 | 0.88 | 0.14 | 0.19 | 0.00 | 0.026 | 0.005 | 141.41 | |
| Incl. | 415.04 | 425.66 | 10.62 | 27.98 | 1.54 | 1.82 | 0.32 | 0.57 | 0.01 | 0.066 | 0.010 | 348.43 |
| Incl. | 437.58 | 443.60 | 6.02 | 33.43 | 2.40 | 2.07 | 0.40 | 0.43 | 0.01 | 0.112 | 0.012 | 442.47 |
| 452.63 | 454.14 | 1.51 | 4.40 | 0.35 | 1.05 | 0.11 | 0.03 | 0.00 | 0.002 | 0.005 | 96.55 | |
| 457.22 | 458.71 | 1.49 | 8.20 | 0.46 | 1.57 | 0.22 | 0.15 | 0.00 | 0.004 | 0.007 | 153.17 | |
| 479.83 | 481.33 | 1.50 | 5.60 | 0.33 | 1.06 | 0.12 | 0.04 | 0.01 | 0.004 | 0.005 | 101.35 | |
| 506.93 | 508.48 | 1.55 | 15.10 | 0.55 | 2.42 | 0.12 | 0.53 | 0.01 | 0.003 | 0.015 | 252.37 | |
| 515.99 | 522.05 | 6.06 | 9.43 | 0.24 | 2.52 | 0.17 | 0.15 | 0.01 | 0.002 | 0.014 | 181.04 | |
| 537.10 | 543.18 | 6.08 | 8.01 | 0.17 | 1.87 | 0.23 | 0.26 | 0.01 | 0.001 | 0.013 | 158.64 | |
| 586.64 | 588.15 | 1.51 | 6.40 | 0.10 | 1.46 | 0.22 | 0.02 | 0.01 | 0.001 | 0.008 | 100.15 | |
| 627.50 | 628.97 | 1.47 | 3.60 | 0.52 | 0.44 | 0.04 | 0.01 | 0.00 | 0.025 | 0.001 | 81.27 | |
| 642.38 | 643.95 | 1.57 | 15.20 | 0.01 | 1.65 | 0.34 | 0.01 | 0.01 | 0.001 | 0.008 | 114.00 | |
| 693.78 | 695.33 | 1.55 | 6.10 | 0.01 | 0.91 | 0.06 | 0.00 | 0.00 | 0.001 | 0.004 | 55.62 | |
| 705.88 | 708.90 | 3.02 | 5.28 | 0.01 | 0.93 | 0.11 | 0.00 | 0.01 | 0.001 | 0.004 | 58.81 | |
| 730.00 | 731.53 | 1.53 | 6.60 | 0.02 | 0.96 | 0.04 | 0.00 | 0.01 | 0.001 | 0.005 | 59.97 | |
| 745.12 | 746.68 | 1.56 | 5.50 | 0.01 | 1.21 | 0.05 | 0.01 | 0.04 | 0.001 | 0.007 | 84.11 | |
| Hole No. | From (m) | To (m) | Length (m) | Ag | Au | Zn | Pb | Cu | Sn | Bi | Cd | Ag eq |
| g/t | g/t | % | % | % | % | % | % | g/t | ||||
| DSB-49 | 3.08 | 74.40 | 71.32 | 6.94 | 0.04 | 0.09 | 0.21 | 0.01 | 0.05 | 0.002 | 0.001 | 43.87 |
| 99.68 | 106.67 | 6.99 | 5.27 | 0.01 | 0.52 | 0.84 | 0.02 | 0.00 | 0.001 | 0.052 | 65.29 | |
| 143.83 | 151.60 | 7.77 | 17.41 | 0.01 | 1.34 | 0.43 | 0.01 | 0.00 | 0.001 | 0.004 | 100.11 | |
| 162.20 | 163.74 | 1.54 | 4.00 | 0.01 | 0.70 | 0.13 | 0.00 | 0.01 | 0.001 | 0.001 | 45.97 | |
| 174.48 | 175.99 | 1.51 | 4.00 | 0.01 | 1.23 | 0.10 | 0.00 | 0.00 | 0.001 | 0.004 | 69.90 | |
| 200.34 | 201.86 | 1.52 | 0.50 | 0.88 | 0.23 | 0.01 | 0.00 | 0.00 | 0.007 | 0.001 | 94.27 | |
| 253.30 | 263.93 | 10.63 | 21.02 | 0.03 | 1.23 | 0.49 | 0.02 | 0.00 | 0.025 | 0.005 | 109.66 | |
| 285.32 | 291.28 | 5.96 | 10.90 | 0.06 | 0.54 | 0.10 | 0.01 | 0.00 | 0.023 | 0.002 | 54.11 | |
| 313.95 | 338.13 | 24.18 | 6.21 | 0.02 | 0.43 | 0.15 | 0.01 | 0.01 | 0.003 | 0.002 | 37.62 | |
| 348.76 | 419.28 | 70.52 | 15.57 | 0.22 | 1.28 | 0.22 | 0.01 | 0.01 | 0.113 | 0.005 | 134.92 | |
| Incl. | 353.33 | 363.92 | 10.59 | 32.75 | 0.10 | 1.88 | 0.26 | 0.02 | 0.05 | 0.040 | 0.008 | 171.67 |
| Incl. | 382.22 | 393.11 | 10.89 | 2.61 | 0.67 | 0.15 | 0.04 | 0.00 | 0.00 | 0.410 | 0.001 | 159.09 |
| Incl. | 402.24 | 414.78 | 12.54 | 31.80 | 0.05 | 4.16 | 0.78 | 0.03 | 0.01 | 0.045 | 0.018 | 281.40 |
| 449.50 | 450.94 | 1.44 | 3.00 | 0.01 | 0.85 | 0.12 | 0.01 | 0.01 | 0.001 | 0.003 | 54.87 | |
| 465.96 | 469.07 | 3.11 | 71.05 | 0.17 | 1.68 | 0.86 | 0.02 | 0.01 | 0.117 | 0.004 | 228.13 | |
| 497.83 | 502.27 | 4.44 | 3.64 | 0.02 | 0.81 | 0.13 | 0.01 | 0.01 | 0.003 | 0.002 | 55.57 | |
| 570.16 | 571.62 | 1.46 | 3.00 | 0.01 | 0.72 | 0.24 | 0.00 | 0.00 | 0.001 | 0.001 | 47.62 | |
| 595.75 | 664.63 | 68.88 | 10.26 | 0.04 | 1.07 | 0.30 | 0.01 | 0.01 | 0.003 | 0.005 | 81.61 | |
| Incl. | 622.87 | 628.85 | 5.98 | 20.43 | 0.17 | 2.39 | 0.37 | 0.01 | 0.01 | 0.006 | 0.010 | 172.19 |
| 669.26 | 670.67 | 1.41 | 3.00 | 0.04 | 0.89 | 0.18 | 0.01 | 0.01 | 0.004 | 0.003 | 61.62 | |
| 684.31 | 695.53 | 11.22 | 12.10 | 0.04 | 0.84 | 0.37 | 0.01 | 0.01 | 0.001 | 0.002 | 73.56 | |
| 716.79 | 738.00 | 21.21 | 4.41 | 0.08 | 0.63 | 0.11 | 0.01 | 0.01 | 0.001 | 0.001 | 50.56 | |
| 756.12 | 759.14 | 3.02 | 6.50 | 0.02 | 1.74 | 0.15 | 0.01 | 0.01 | 0.001 | 0.005 | 105.26 | |
| 766.69 | 769.81 | 3.12 | 6.39 | 0.01 | 0.65 | 0.17 | 0.01 | 0.01 | 0.001 | 0.002 | 49.87 | |
Table 2 (con’t) –
| Hole No. | From (m) | To (m) | Length (m) | Ag | Au | Zn | Pb | Cu | Sn | Bi | Cd | Ag eq |
| g/t | g/t | % | % | % | % | % | % | g/t | ||||
| DSB-50 | 0.00 | 103.81 | 103.81 | 4.29 | 0.02 | 0.06 | 0.13 | 0.01 | 0.07 | 0.002 | 0.001 | 41.06 |
| 117.59 | 119.01 | 1.42 | 2.00 | 0.23 | 0.11 | 0.62 | 0.02 | 0.01 | 0.023 | 0.001 | 59.30 | |
| 129.75 | 155.43 | 25.68 | 15.38 | 0.11 | 0.43 | 0.43 | 0.01 | 0.01 | 0.031 | 0.024 | 73.81 | |
| 162.92 | 268.34 | 105.42 | 13.57 | 0.02 | 0.99 | 0.41 | 0.01 | 0.02 | 0.001 | 0.004 | 86.67 | |
| Incl. | 220.07 | 230.64 | 10.57 | 15.34 | 0.01 | 3.22 | 0.17 | 0.04 | 0.02 | 0.002 | 0.013 | 193.50 |
| 278.84 | 290.87 | 12.03 | 8.28 | 0.26 | 0.31 | 0.18 | 0.01 | 0.01 | 0.269 | 0.001 | 112.50 | |
| Incl. | 283.40 | 290.87 | 7.47 | 4.05 | 0.26 | 0.14 | 0.15 | 0.00 | 0.00 | 0.425 | 0.001 | 130.16 |
| 299.95 | 301.45 | 1.50 | 14.00 | 0.01 | 0.72 | 0.35 | 0.02 | 0.00 | 0.002 | 0.003 | 65.24 | |
| 337.64 | 340.67 | 3.03 | 10.05 | 0.02 | 0.81 | 0.41 | 0.02 | 0.00 | 0.003 | 0.001 | 69.44 | |
| 355.67 | 361.68 | 6.01 | 20.16 | 0.05 | 1.61 | 0.36 | 0.01 | 0.00 | 0.002 | 0.007 | 119.29 | |
| 384.37 | 407.10 | 22.73 | 3.41 | 0.01 | 0.82 | 0.08 | 0.01 | 0.00 | 0.003 | 0.003 | 50.40 | |
| 422.13 | 423.70 | 1.57 | 3.00 | 0.01 | 1.02 | 0.11 | 0.01 | 0.00 | 0.001 | 0.004 | 58.99 | |
| 481.16 | 482.67 | 1.51 | 17.00 | 0.08 | 2.45 | 0.82 | 0.03 | 0.01 | 0.013 | 0.012 | 181.44 | |
| 526.40 | 536.91 | 10.51 | 6.13 | 0.01 | 0.58 | 0.40 | 0.01 | 0.01 | 0.001 | 0.003 | 51.80 | |
| 545.97 | 555.14 | 9.17 | 15.73 | 0.38 | 0.49 | 0.26 | 0.01 | 0.00 | 0.011 | 0.003 | 87.74 | |
| 568.74 | 571.75 | 3.01 | 19.18 | 0.05 | 0.81 | 0.91 | 0.01 | 0.02 | 0.002 | 0.004 | 101.29 | |
| 591.41 | 628.87 | 37.46 | 10.83 | 0.07 | 1.81 | 0.31 | 0.01 | 0.02 | 0.003 | 0.009 | 125.32 | |
| Incl. | 591.41 | 595.77 | 4.36 | 11.03 | 0.27 | 2.95 | 0.32 | 0.01 | 0.02 | 0.003 | 0.015 | 200.81 |
| Incl. | 603.24 | 607.78 | 4.54 | 28.69 | 0.23 | 5.52 | 0.65 | 0.04 | 0.02 | 0.015 | 0.027 | 361.08 |
| Incl. | 613.94 | 621.32 | 7.38 | 18.41 | 0.03 | 2.30 | 0.55 | 0.01 | 0.02 | 0.001 | 0.011 | 162.39 |
| 639.43 | 642.51 | 3.08 | 17.27 | 0.07 | 2.28 | 0.12 | 0.02 | 0.02 | 0.002 | 0.011 | 148.51 | |
| 656.06 | 666.65 | 10.59 | 3.64 | 0.01 | 0.63 | 0.10 | 0.00 | 0.01 | 0.001 | 0.002 | 42.59 | |
| 678.71 | 680.20 | 1.49 | 6.00 | 0.01 | 0.65 | 0.32 | 0.00 | 0.01 | 0.001 | 0.002 | 51.35 | |
| 701.42 | 711.72 | 10.30 | 12.09 | 0.17 | 2.06 | 0.39 | 0.02 | 0.02 | 0.003 | 0.008 | 151.06 | |
| 738.93 | 744.96 | 6.03 | 4.84 | 0.05 | 0.85 | 0.12 | 0.01 | 0.01 | 0.004 | 0.003 | 61.44 | |
| 763.08 | 764.60 | 1.52 | 3.00 | 0.02 | 0.70 | 0.12 | 0.01 | 0.00 | 0.003 | 0.003 | 45.79 | |
| 836.89 | 839.93 | 3.04 | 11.01 | 0.23 | 0.84 | 0.12 | 0.01 | 0.00 | 0.014 | 0.004 | 83.26 | |
| 847.39 | 848.92 | 1.53 | 4.00 | 0.01 | 1.11 | 0.04 | 0.01 | 0.01 | 0.001 | 0.004 | 63.47 | |
| Hole No. | From (m) | To (m) | Length (m) | Ag | Au | Zn | Pb | Cu | Sn | Bi | Cd | Ag eq |
| g/t | g/t | % | % | % | % | % | % | g/t | ||||
| DSB-51 | 27.20 | 28.73 | 1.53 | 1.80 | 0.01 | 0.02 | 0.07 | 0.00 | 0.12 | 0.001 | 0.001 | 50.93 |
| 33.60 | 35.10 | 1.50 | 1.40 | 0.01 | 0.01 | 0.03 | 0.00 | 0.13 | 0.001 | 0.001 | 53.10 | |
| 87.47 | 99.50 | 12.03 | 10.58 | 0.83 | 0.18 | 0.11 | 0.20 | 0.00 | 0.054 | 0.001 | 133.99 | |
| 109.95 | 114.50 | 4.55 | 1.93 | 0.26 | 0.39 | 0.04 | 0.01 | 0.01 | 0.007 | 0.007 | 51.61 | |
| 120.40 | 141.43 | 19.51 | 7.95 | 0.39 | 0.43 | 0.04 | 0.13 | 0.00 | 0.024 | 0.001 | 87.59 | |
| 189.66 | 194.14 | 4.48 | 55.04 | 0.21 | 1.12 | 0.38 | 0.31 | 0.00 | 0.044 | 0.003 | 187.89 | |
| 203.20 | 204.69 | 1.49 | 5.10 | 0.01 | 2.10 | 0.17 | 0.01 | 0.01 | 0.001 | 0.009 | 120.52 | |
| 228.70 | 230.19 | 1.49 | 24.10 | 0.02 | 2.84 | 0.32 | 0.01 | 0.00 | 0.008 | 0.012 | 180.69 | |
| 240.70 | 243.75 | 3.05 | 3.73 | 0.05 | 0.88 | 0.15 | 0.01 | 0.00 | 0.001 | 0.002 | 58.83 | |
| 254.31 | 397.37 | 143.06 | 5.18 | 0.02 | 1.72 | 0.21 | 0.02 | 0.00 | 0.002 | 0.006 | 103.03 | |
| Incl. | 346.09 | 395.96 | 49.87 | 9.39 | 0.03 | 2.96 | 0.35 | 0.03 | 0.00 | 0.003 | 0.011 | 175.06 |
| 409.49 | 419.94 | 10.45 | 4.37 | 0.01 | 0.89 | 0.21 | 0.01 | 0.01 | 0.001 | 0.003 | 59.37 | |
| 436.54 | 438.04 | 1.50 | 2.60 | 0.01 | 1.05 | 0.21 | 0.01 | 0.00 | 0.001 | 0.004 | 64.14 | |
| 477.16 | 510.20 | 33.04 | 15.24 | 0.08 | 2.07 | 0.42 | 0.02 | 0.01 | 0.006 | 0.010 | 143.70 | |
| Incl. | 480.19 | 501.18 | 20.99 | 20.76 | 0.10 | 2.83 | 0.61 | 0.02 | 0.01 | 0.003 | 0.013 | 194.49 |
| 541.89 | 558.36 | 16.47 | 8.88 | 0.11 | 0.94 | 0.25 | 0.00 | 0.01 | 0.002 | 0.004 | 77.20 | |
| 583.97 | 585.46 | 1.49 | 5.40 | 0.01 | 0.83 | 0.23 | 0.02 | 0.01 | 0.001 | 0.003 | 59.20 | |
| 591.54 | 599.04 | 7.50 | 14.46 | 0.50 | 2.99 | 0.28 | 0.23 | 0.01 | 0.003 | 0.015 | 248.02 | |
| 608.11 | 623.17 | 15.06 | 8.61 | 0.03 | 0.82 | 0.09 | 0.02 | 0.01 | 0.001 | 0.004 | 60.04 | |
| 632.28 | 633.80 | 1.52 | 5.30 | 0.04 | 0.73 | 0.13 | 0.01 | 0.00 | 0.001 | 0.003 | 51.51 | |
| 659.40 | 660.90 | 1.50 | 7.40 | 0.48 | 1.02 | 0.11 | 0.12 | 0.00 | 0.001 | 0.004 | 119.55 | |
| 669.85 | 671.40 | 1.55 | 3.30 | 0.10 | 0.51 | 0.09 | 0.01 | 0.01 | 0.006 | 0.001 | 44.95 | |
| 766.07 | 769.04 | 2.97 | 11.59 | 0.01 | 0.56 | 0.06 | 0.01 | 0.01 | 0.001 | 0.002 | 45.73 | |
| 787.00 | 788.50 | 1.50 | 2.20 | 0.22 | 0.64 | 0.07 | 0.01 | 0.01 | 0.013 | 0.001 | 62.14 | |
Table 2 (con’t) –
| Hole No. | From (m) | To (m) | Length (m) | Ag | Au | Zn | Pb | Cu | Sn | Bi | Cd | Ag eq |
| g/t | g/t | % | % | % | % | % | % | g/t | ||||
| DSB-52 | 6.45 | 7.92 | 1.47 | 1.40 | 0.01 | 0.00 | 0.02 | 0.00 | 0.12 | 0.001 | 0.001 | 50.31 |
| 58.14 | 92.70 | 34.56 | 5.27 | 0.03 | 0.10 | 0.02 | 1.35 | 0.00 | 0.001 | 0.002 | 170.69 | |
| Incl. | 76.06 | 86.67 | 10.61 | 7.70 | 0.05 | 0.10 | 0.01 | 3.60 | 0.00 | 0.001 | 0.001 | 434.10 |
| 104.78 | 113.78 | 9.00 | 16.51 | 0.13 | 0.37 | 0.15 | 0.32 | 0.00 | 0.021 | 0.006 | 94.69 | |
| 177.43 | 178.88 | 1.45 | 4.70 | 0.07 | 0.69 | 0.09 | 0.03 | 0.00 | 0.003 | 0.001 | 53.41 | |
| 210.70 | 212.23 | 1.53 | 2.80 | 0.15 | 1.00 | 0.13 | 0.03 | 0.01 | 0.001 | 0.003 | 75.08 | |
| 236.43 | 237.94 | 1.51 | 2.60 | 0.01 | 0.87 | 0.14 | 0.01 | 0.01 | 0.001 | 0.003 | 54.85 | |
| 248.65 | 267.07 | 18.42 | 5.85 | 0.07 | 0.84 | 0.13 | 0.02 | 0.00 | 0.002 | 0.003 | 61.46 | |
| Incl. | 257.99 | 264.09 | 6.10 | 7.52 | 0.13 | 1.85 | 0.26 | 0.01 | 0.00 | 0.002 | 0.006 | 121.67 |
| 274.70 | 394.47 | 119.77 | 7.46 | 0.14 | 1.85 | 0.26 | 0.01 | 0.00 | 0.005 | 0.007 | 123.28 | |
| Incl. | 295.89 | 323.18 | 27.29 | 6.13 | 0.08 | 1.89 | 0.32 | 0.01 | 0.00 | 0.002 | 0.007 | 119.70 |
| Incl. | 342.86 | 371.65 | 28.79 | 18.03 | 0.45 | 4.55 | 0.47 | 0.03 | 0.00 | 0.016 | 0.018 | 306.28 |
| 414.19 | 415.73 | 1.54 | 7.10 | 0.01 | 1.57 | 0.53 | 0.01 | 0.00 | 0.001 | 0.007 | 104.43 | |
| 421.76 | 423.29 | 1.53 | 10.10 | 0.01 | 0.46 | 0.22 | 0.00 | 0.00 | 0.018 | 0.001 | 45.37 | |
| 453.60 | 458.17 | 4.57 | 21.44 | 0.08 | 0.86 | 0.31 | 0.02 | 0.00 | 0.011 | 0.003 | 87.03 | |
| 494.38 | 531.20 | 36.82 | 4.77 | 0.08 | 1.05 | 0.24 | 0.04 | 0.00 | 0.002 | 0.005 | 77.28 | |
| 584.04 | 635.60 | 51.56 | 12.13 | 0.09 | 0.96 | 0.21 | 0.06 | 0.00 | 0.012 | 0.004 | 85.12 | |
| Incl. | 584.04 | 591.60 | 7.56 | 60.67 | 0.55 | 3.52 | 0.63 | 0.35 | 0.01 | 0.075 | 0.016 | 363.38 |
| 646.23 | 647.75 | 1.52 | 9.70 | 0.01 | 0.75 | 0.16 | 0.01 | 0.00 | 0.004 | 0.003 | 55.03 | |
| 662.81 | 694.57 | 31.76 | 13.17 | 0.28 | 0.66 | 0.18 | 0.07 | 0.01 | 0.002 | 0.002 | 90.35 | |
| Incl. | 677.96 | 687.00 | 9.04 | 25.53 | 0.83 | 1.05 | 0.21 | 0.16 | 0.02 | 0.005 | 0.003 | 188.17 |
| 717.20 | 720.23 | 3.03 | 7.79 | 0.02 | 1.61 | 0.24 | 0.01 | 0.00 | 0.007 | 0.007 | 100.27 | |
| 727.80 | 745.95 | 18.15 | 9.40 | 0.03 | 0.74 | 0.10 | 0.02 | 0.00 | 0.006 | 0.003 | 56.23 | |
| 752.02 | 753.53 | 1.51 | 8.50 | 0.01 | 1.19 | 0.20 | 0.01 | 0.00 | 0.002 | 0.005 | 76.72 | |
| 765.61 | 807.87 | 42.26 | 9.82 | 0.04 | 0.77 | 0.10 | 0.01 | 0.00 | 0.002 | 0.003 | 58.02 | |
| Incl. | 789.82 | 795.85 | 6.03 | 41.56 | 0.20 | 1.14 | 0.15 | 0.06 | 0.00 | 0.008 | 0.006 | 131.23 |
See note Table 1
Qualified Person
Dr. Osvaldo Arce, P. Geo., General Manager of Eloro’s Bolivian subsidiary, Minera Tupiza S.R.L., and a Qualified Person in the context of NI 43-101, has reviewed and approved the technical content of this news release. Dr. Bill Pearson, P.Geo., Executive Vice President Exploration Eloro, and who has more than 45 years of worldwide mining exploration experience, including extensive work in South America, manages the overall technical program, working closely with Dr. Osvaldo Arce, P.Geo. Dr. Quinton Hennigh, P.Geo., Senior Technical Advisor to Eloro and Independent Technical Advisor, Mr. Charley Murahwi P. Geo., FAusIMM of Micon are regularly consulted on technical aspects of the project.
Eloro is utilizing both ALS and AHK for drill core analysis, both of whom are major international accredited laboratories. Drill samples sent to ALS are prepared in both ALS Bolivia Ltda’s preparation facility in Oruro, Bolivia and the preparation facility operated by AHK in Tupiza with pulps sent to the main ALS Global laboratory in Lima for analysis. More recently Eloro has had ALS send pulps to their laboratory at Galway in Ireland. Eloro employs an industry standard QA/QC program with standards, blanks and duplicates inserted into each batch of samples analyzed with selected check samples sent to a separate accredited laboratory.
Drill core samples sent to AHK Laboratories are prepared in a preparation facility installed and managed by AHK in Tupiza with pulps sent to the AHK laboratory in Lima, Peru. Au and Sn analysis on these samples is done by ALS Bolivia Ltda in Lima. Check samples between ALS and AHK are regularly done as a QA/QC check. AHK is following the same analytical protocols used as with ALS and with the same QA/QC protocols. Turnaround time continues to improve, as laboratories return to more normal staffing levels.
About Iska Iska
Iska Iska silver-tin polymetallic project is a road accessible, royalty-free property, wholly controlled by the Title Holder, Empresa Minera Villegas S.R.L. and is located 48 km north of Tupiza city, in the Sud Chichas Province of the Department of Potosi in southern Bolivia. Eloro has an option to earn a 100% interest in Iska Iska.
Iska Iska is a major silver-tin polymetallic porphyry-epithermal complex associated with a Miocene possibly collapsed/resurgent caldera, emplaced on Ordovician age rocks with major breccia pipes, dacitic domes and hydrothermal breccias. The caldera is 1.6km by 1.8km in dimension with a vertical extent of at least 1km. Mineralization age is similar to Cerro Rico de Potosí and other major deposits such as San Vicente, Chorolque, Tasna and Tatasi located in the same geological trend.
Eloro began underground diamond drilling from the Huayra Kasa underground workings at Iska Iska on September 13, 2020. On November 18, 2020, Eloro announced the discovery of a significant breccia pipe with extensive silver polymetallic mineralization just east of the Huayra Kasa underground workings and a high-grade gold-bismuth zone in the underground workings. On November 24, 2020, Eloro announced the discovery of the SBBP approximately 150m southwest of the Huayra Kasa underground workings.
Subsequently, on January 26, 2021, Eloro announced significant results from the first drilling at the SBBP including the discovery hole DHK-15 which returned 129.60 g Ag eq/t over 257.5m (29.53 g Ag/t, 0.078g Au/t, 1.45% Zn, 0.59% Pb, 0.080% Cu, 0.056% Sn, 0.0022% In and 0.0064% Bi from 0.0m to 257.5m. Subsequent drilling has confirmed significant values of Ag-Sn polymetallic mineralization in the SBBP and the adjacent CBP. A substantive mineralized envelope which is open along strike and down-dip extends around both major breccia pipes. Continuous channel sampling of the Santa Barbara Adit located to the east of SBBP returned 442 g Ag eq/t (164.96 g Ag/t, 0.46% Sn, 3.46% Pb and 0.14% Cu) over 166m including 1,092 g Ag eq/t (446 g Ag/t, 9.03% Pb and 1.16% Sn) over 56.19m. The west end of the adit intersects the end of the SBBP.
Since the initial discovery hole, Eloro has released a number of significant drill results in the SBBP and the surrounding mineralized envelope which along with geophysical data has defined an extensive target zone. In its September 20, 2022 press release, the Company reported that new downhole geophysical data has significantly extended the strike length of the high-grade feeder zone at Santa Barbara a further 250m along strike to the south-southeast from existing drilling. The 3D inverse magnetic model which correlates very strongly with the conductive zone suggested that the high-grade feeder zone may extend across the entire caldera for as much as a further 1 km along strike for a total potential strike length of at least 2 km. As reported, the definition drill program was modified to sectionally drill this potential extension with the intention of defining a major open pittable deposit in the valley of the caldera.
The Company completed 84,495m of drilling in 122 holes from the definition drill program in the Santa Barbara target area.
On November 22, 2022, Eloro announced the acquisition of the Mina Casiterita and Mina Hoyada properties covering 14.75 km2 southwest and west of Iska Iska. These properties connect with the TUP-3 and TUP-6 claims previously staked by Eloro. Eloro has also staked additional land in the area. Following the acquisition, the total land package in the Iska Iska area to be controlled by Eloro will total 1,935 quadrants covering 483.75 km2.
Artisanal mining in the 1960’s identified high grade tin (Sn) veins on the Mina Casiterita property that are hosted in an intrusive dacite. Production from 1962 to 1964 is reported by the Departamento Nacional de Geología in Bolivia to be 69.85 tonnes grading 50.60% Sn.
Recently completed magnetic surveys by Eloro has outlined an extensive, near surface, magnetic intrusive body on the Mina Casiterita property immediately southwest of Iska Iska. This intrusive hosts the previously mined high-grade tin veins and is very likely the continuation of the porphyry tin intrusion projected to be below the epithermal Ag-Sn-Zn-Pb mineralization at Iska Iska.
The Porco adit from which previously reported channel sampling returned 103m grading 521 g Ag eq/t (including g 117g Ag/t, 1.44 g Au/t, 0.54% Cu and 0.66% Sn) in altered basement sediments, is located near the northeast part of the magnetic anomaly, attesting to the potential strength and high-grade nature of the mineralized system in the area.
Drilling is planned in the Porco area and on Mina Casiterita commencing in early February 2023 with geological mapping, sampling and geophysical surveys now in progress on the full land package across the Iska Iska region.
About Eloro Resources Ltd.
Eloro is an exploration and mine development company with a portfolio of gold and base-metal properties in Bolivia, Peru and Quebec. Eloro has an option to acquire a 100% interest in the highly prospective Iska Iska Property, which can be classified as a polymetallic epithermal-porphyry complex, a significant mineral deposit type in the Potosi Department, in southern Bolivia. A recent NI 43-101 Technical Report on Iska Iska, which was completed by Micon International Limited, is available on Eloro’s website and under its filings on SEDAR. Iska Iska is a road-accessible, royalty-free property. Eloro also owns an 82% interest in the La Victoria Gold/Silver Project, located in the North-Central Mineral Belt of Peru some 50 km south of Barrick’s Lagunas Norte Gold Mine and Pan American Silver’s La Arena Gold Mine.
For further information please contact either Thomas G. Larsen, Chairman and CEO or Jorge Estepa, Vice-President at (416) 868-9168.
Information in this news release may contain forward-looking information. Statements containing forward-looking information express, as at the date of this news release, the Company’s plans, estimates, forecasts, projections, expectations, or beliefs as to future events or results and are believed to be reasonable based on information currently available to the Company. There can be no assurance that forward-looking statements will prove to be accurate. Actual results and future events could differ materially from those anticipated in such statements. Readers should not place undue reliance on forward-looking information.
Neither the TSX nor its Regulation Services Provider (as that term is defined in the policies of the TSX) accepts responsibility for the adequacy or accuracy of this release.
Eloro Resources’ drill hole DHK-27 intersects 202.43g Ag eq/t (69.80g Ag/t, 1.21% Zn, 0.49% Pb, and 0.12%Sn) over 325.48m including a higher-grade portion of 395.98 g Ag eq/t (182.02g Ag/t, 1.73% Zn, 0.97% Pb, 0.18% Cu and 0.19%Sn) over 109.60m in the High-Grade Zone, Santa Barbara Deposit at the Iska Iska Silver-Tin Polymetallic Project, Potosi Department, Bolivia
Eloro Resources Ltd. (TSX-V: ELO; OTCQX: ELRRF; FSE: P2QM) (“Eloro”, or the “Company”) is pleased to announce assay results from eight (8) additional diamond drill holes from its definition drilling program at the Iska Iska silver-tin polymetallic project in the Potosi Department, southern Bolivia. Hole DHK-27 was drilled from Huayra Kasa due west at -45 degrees to a length of 860m to fill-in gaps in previous drilling of the High-Grade Zone. Five (5) additional holes (DHK-26. DHK-28, DHK-29, DHK-30 and DSB-42) were drilled to the southwest from the Huayra Kasa area to test the eastern margin of the Santa Barbara deposit. Hole DSB-43 was drilled on southwest side of Santa Barbara and hole DSB-46 tested the potential south-southeastern extension.
As previously reported in a press release dated November 27, 2022, the Company completed 84,495m of drilling in 122 holes to complete the definition drill program in the Santa Barbara target area, as shown in Figure 1. Tables 1 and 2 list significant assay results for the reported drill holes. Prices used for calculating Ag equivalent grades are as outlined in Eloro’s July 21, 2022 press release. Table 3 summarizes drill holes completed but with assays pending. The remaining eight (8) holes outstanding are in the south-southeastern extension area of the southern part of the Iska Iska caldera.
In addition to the new drill results, the Company is pleased to report on channel sampling results from the Mina 1 and Mina 2 underground workings located approximately 2km south-southeast of the Santa Barbara adit and approximately 800m east of the Porco adit where previously reported channel sampling returned a 103m strike length grading 521 g Ag eq/t (g 117g Ag/t, 1.44 g Au/t, 0.54% Cu and 0.66% Sn) in altered basement sediments (see Eloro’s November 17, 2021 press release). The location of Mina 1 and Mina 2 is shown in Figure 1. Complete channel sampling results are listed in Tables 4 and 5.
Tom Larsen, CEO of Eloro, said: “Hole DHK-27 when determining grade times intercept of 65,887 g Ag eq/t-m is the 2nd most valuable drill hole recorded to date and only just behind the 441-meter 66,389 g Ag eq/t-m intersection in hole DSB-30 reported last fall (see press release September 20, 2022). These are remarkable intercepts and grades. The significance of DHK-27 is the consistent high silver grades averaging 69.80 g Ag/t over a length of 325.48 meters which is close to true thickness. The higher grade 182.02 g Ag/t over 109.60 m portion of Hole DHK-27 attests to the potential of outlining much higher-grade areas in the Santa Barbara deposit with further drilling. It is also important to note that calculations for equivalent Ag grade in this release are based on July 2022 metal prices which for the major metals at Iska Iska are 13% to 33% lower than current prices hence the quoted values for silver equivalent are conservative.”
“The technical team under the supervision of Dr. Bill Pearson, P.Geo. and Dr. Osvaldo Arce, P.Geo. are setting up for resumption of diamond drilling in early February that will target the major tin porphyry that they believe is below the Iska Iska porphyry and extends into the newly acquired Mina Casiterita property,” continued Mr. Larsen. “Eloro has a remarkable opportunity to outline a second, potential world class tin deposit at Iska Iska in addition to the already extensive Santa Barbara silver-tin polymetallic deposit which is the focus of our inaugural mineral resource estimate expected by the end of Q1 2023. Expect to see a lot of activity in and around Iska Iska in 2023!”
Dr. Bill Pearson, P.Geo. Eloro’s Executive Vice President, Exploration commented: “We are working closely with Micon International to ensure that they have all the data necessary to complete the inaugural mineral resource estimate on the Santa Barbara deposit targeted for the end of Q1 2023. Blue Coast Research in Parksville, B.C. is completing their metallurgical studies and Gemin Associates in Lima, Peru is preparing preliminary economic parameters for the mineral resource estimation. On the ground, the Company has commenced induced polarization surveys on the Mina Casiterita property and is preparing for the restart of drilling in early February. The next phase of exploration drilling will target the potential tin porphyry in the Porco and Mina Casiterita areas. In addition, we have also initiated a program of geological mapping, sampling, and prospecting to evaluate the newly staked properties in the Iska Iska area which are detailed in our November 22, 2022 press release.”
Updated Geological Model for Iska Iska and its Santa Barbara Deposit
Drilling across the valley of the Iska Iska Caldera indicates that this area is underlain by a coarse-grained porphyritic dacitic intrusion that is well mineralized with Ag, Zn and Pb and is the likely source of the extensive epithermal mineralization in the Santa Barbara and Central Breccia areas. The porphyry, now named the Iska Iska Porphyry, is approximately 800m by 600m (Figure 1) and is notable for the absence of tin mineralization despite the abundance of tin in the nearby area. The tin at Iska Iska has been long recognized by Dr. Osvaldo Arce, P.Geo., an expert on Bolivian geology, as likely being the product of an earlier higher temperature and deeper tin porphyry, which has been overprinted by the later higher-level porphyry-epithermal Ag-Zn-Pb mineralization related to the Iska Iska porphyry.
Detailed analysis and modeling of the geological, geophysical, and geochemical data at Iska Iska indicates that the hydrothermal signature for the Iska Iska porphyry-epithermal system is approximately 2.8km along strike, up to 1.2km across strike and extending to a depth of at least 1.4km (Figure 1).
The High-Grade Zone that occurs within this extensive hydrothermal system defined by the >90 g Ag eq/t grade shell model is approximately 1,000m along strike, 800m wide and extends to a depth of 1,100m (Figure 2). This zone is open to the south, west and northwest as well as at depth. Magnetic inverse modelling and limited deep drilling suggest that the major tin porphyry is likely below the Iska Iska Porphyry and to the south and southwest in the Porco and Mina Casiterita areas.
The definition drilling program has more than doubled the potential volume of high grade mineralized material to be assessed for the mineral resource. Figure 2 shows the >90 g Ag eq/t grade shell model released September 20, 2022, compared to the date of this release. The success of the definition drilling in expanding the >90 g Ag eq/t zone is readily evident in Table 6, below and in Figure 2.
Table 6: Comparison of September 2022, >90 g Ag eq/t Grade Shell Model versus January 2023 Model for Santa Barbara Deposit
| Dimension | September 2022 Model | January 2023 Model | Increase (m) | % Increase | |
| Strike | 700m | 1,000m | 300m | 42 | % |
| Width | 650m | 800m | 150m | 23 | % |
| Depth | 810m | 1,100m | 290m | 36 | % |
The overall mineralized zone as defined by the >30 g Ag eq/t grade shell has a strike length of 2,200m, a width of 1,200m and extends to a depth of at least 1,400m. Note that much of the drilling at Santa Barbara is at 100m spacing hence further drilling will likely provide better definition of higher-grade zones within the extensive mineralized envelope.
Santa Barbara Definition Drilling Huayra Kasa Area
Hole DHK-27 was drilled from Huayra Kasa due west at -45 degrees to a length of 860m. 50% of this hole returned reportable intersections averaging 172.09 g Ag eq/t. The silver grades in this hole are the highest and most extensive yet intersected in the Santa Barbara deposit.
Highlights from Hole DHK-27
- 202.43g Ag eq/t (69.80g Ag/t, 1.21% Zn, 0.49% Pb, and 0.12%Sn) over 325.48m from 93.30m to 418.78m, including a higher-grade portion of:
- 395.98 g Ag eq/t (182.02g Ag/t, 1.73% Zn, 0.97% Pb, 0.18% Cu and 0.19%Sn) over 109.60m from 198.41m to 308.01m.
Five (5) additional holes (DHK-26. DHK-28, DHK-29, DHK-30 and DSB-42) were collared in the Huayra Kasa area to test the eastern margin of the Santa Barbara deposit. All these holes were drilled at an azimuth of 2250 with a dip of -600. Collectively, these holes intersected many significant intersections within altered and mineralized dacite and dacitic breccia including:
Highlights from Hole DHK-26
- 221.51g Ag eq/t (28.44 Ag/t, 3.11% Zn and 0.26% Pb) over 53.90m from 729.40m to 783.30m including:
- 486.82g Ag eq/t (89.75g Ag/t, 0.21 g Au/t, 6.23% Zn and 0.83% Pb) over 7.42m from 751.84m to 759.26m.
- 517.28g Ag eq/t (50.66g Ag/t, 0.13 g Au/t, 7.95% Zn, 0.38% Pb and 0.10 % Sn) over 12.08m from 769.72m to 781.80m.
- 99.76g Ag eq/t (32.59g Ag/t, 0.11 g Au/t, 0.54% Zn and 0.18% Pb) over 82.38m from 819.50m to 901.88m including:
- 238.64g Ag eq/t (115.01g Ag/t, 0.09 g Au/t, 0.76% Zn, 0.38% Pb and 0.12% Sn) over 7.59m from 838.63m to 846.22m.
- 273.63g Ag eq/t (149.42g Ag/t, 0.26 g Au/t, 1.54% Zn and 0.41% Pb) over 7.52m from 853.72m to 861.24m.
- 187.82g Ag eq/t (33.08g Ag/t, 0.26 g Au/t 1.54% Zn and 0.49% Pb) over 7.53m from 877.72m to 885.25m.
Highlights from Hole DHK-28
- 140.99g Ag eq/t (25.01g Ag/t, 1.85% Zn and 0.64% Pb) over 7.52m from 174.18m to 181.70m.
- 125.48g Ag eq/t (5.01g Ag/t and 2.10% Zn) over 6.04m from 413.20m to 419.24m.
- 79.22g Ag eq/t (26.26g Ag/t, 0.35% Zn and 0.33% Pb) over 141.56m from 728.88m to 870.44m including:
- 162.77g Ag eq/t (67.00g Ag/t, 0.55% Zn and 1.30% Pb) over 23.85m from 734.70m to 758.55m.
Highlights from Hole DHK-29
- 176.28g Ag eq/t (19.10g Ag/t, 2.29% Zn and 0.27% Pb) over 21.30m from 206.30m to 227.60m.
- 156.90g Ag eq/t (30.88g Ag/t, 0.19 g Au/t, 1.67% Zn and 0.10% Pb) over 10.78m from 608.85m to 619.63m.
- 82.48g Ag eq/t (5.07g Ag/t, 0.21 g Au/t, 0.78% Zn and 0.18% Pb) over 69.18m from 727.12m to 796.30m.
Highlights from Hole DHK-30
- 113.69g Ag eq/t (17.63g Ag/t, 0.19 g Au/t, 1.13% Zn and 0.34% Pb) over 7.54m from 136.52m to 144.06m.
- 116.22g Ag eq/t (14.31g Ag/t, 0.43 g Au/t, 0.86% Zn and 0.10% Pb) over 6.08m from 382.93m to 389.01m.
- 430.17g Ag eq/t (63.65g Ag/t, 0.23 g Au/t, 0.29% Zn, 1.02% Pb, 0.70% Sn and 0.13% Bi) over 2.94m from 559.68m to 562.62m.
Highlights from Hole DSB-42
- 494.23g Ag eq/t (3.03g Ag/t, 4.59 g Au/t, 0.63% Zn and 0.15% Pb) over 2.99m from 51.71m to 54.70m.
- 63.86g Ag eq/t (2.66g Ag/t, 1.01% Zn and 0.21% Pb) over 31.72m from 374.64m to 406.36m, including a higher-grade section of:
- 161.05g Ag eq/t (5.33g Ag/t, 2.74% Zn and 0.32% Pb) over 4.53m from 385.25m to 389.78m.
- 260.46g Ag eq/t (67.81g Ag/t, 0.11 g Au/t, 2.58% Zn and 1.42% Pb) over 18.21m from 442.58m to 460.79m, including a higher-grade section of:
- 678.61g Ag eq/t (189.03 g Ag/t, 0.30 g Au/t, 6.40% Zn and 3.76% Pb) over 6.08m from 445.60m to 551.68m.
- 138.95g Ag eq/t (22.69g Ag/t, 1.65% Zn and 0.75% Pb) over 10.52m from 477.38m to 487.90m.
- 130.69g Ag eq/t (7.19g Ag/t, 1.83% Zn and 0.48% Pb) over 42.17m from 519.62m to 561.79m, including a higher-grade section of:
- 283.75g Ag eq/t (17.53g Ag/t, 0.13 g Au/t, 3.97% Zn and 1.31% Pb) over 13.49m from 519.62m to 533.11m.
- 129.98g Ag eq/t (19.71g Ag/t, 1.50% Zn and 0.57% Pb) over 72.31m from 596.33m to 668.64m, including a higher-grade section of:
- 208.42g Ag eq/t (33.10g Ag/t, 2.37% Zn and 1.00% Pb) over 34.64m from 634.00m to 668.64m.
- 57.11g Ag eq/t (1.75g Ag/t, 0.67% Zn and 0.13% Pb) over 78.10m from 685.15m to 763.25m, including a higher-grade section of:
- 120.06g Ag eq/t (2.95g Ag/t, 1.61% Zn and 0.30% Pb) over 13.21m from 742.49m to 755.70m.
Hole DSB-43 tested the southwest side of Santa Barbara while hole DSB-46 tested the south-southeast extension. Highlights in these two holes are as follows:
Highlights from Hole DSB-43
128.40g Ag eq/t (58.77g Ag/t, 0.12% Zn, 0.08% Pb, 0.10% Cu and 0.11% Sn) over 28.75m from 434.28m to 463.03m, with higher-grade portions of:
- 190.20g Ag eq/t (94.23g Ag/t, 0.11% Zn, 0.11% Pb, 0.15% Cu and 0.14% Sn) over 16.60m from 438.90m to 455.50m.
- 103.50g Ag eq/t (16.83g Ag/t, 0.14 g Au/t, 0.30% Zn, 0.26% Pb and 0.12% Sn) over 15.02m from 650.28m to 665.30m.
Highlights from Hole DSB-46
- 107.44g Ag eq/t (5.83g Ag/t, 1.75% Zn, 0.12% Pb) over 33.50m from 504.15m to 537.65m, with a higher-grade portion of:
- 137.05g Ag eq/t (6.58g Ag/t, 2.20% Zn and 0.14% Pb) over 10.77m from 510.18m to 520.95m.
- 257.17g Ag eq/t (15.28g Ag/t, 4.39% Zn and 0.26% Pb) over 6.07m from 531.58m to 537.65m.
Channel Sampling Mina 1 and Mina 2
Channel sampling of the Mina1 and Mina2 underground workings in the southern part of the property, approximately 2km south-southeast of the Santa Barbara adit, returned significant values from vein breccias as follows:
- 153.94g Ag eq/t (55.03g Ag/t, 0.11 g Au/t, 0.70% Zn, 0.16% Pb and 0.08% Sn) over 145.95m of the northwest trending drift, including a higher-grade portion of 285.16g Ag eq/t (120.18g Ag/t, 0.25 g Au/t 1.23% Zn, 0.30% Pb and 0.13% Sn) over 56.34m in Mina 1.
- 382.79g Ag eq/t (15.67g Ag/t, 1.70 g Au/t, 2.20% Zn and 0.75% Pb) over 68.53m in an east-west trending crosscut in Mina 2. A second shorter crosscut on a secondary subparallel structure approximately 20m to the south returned 475.78g Ag eq/t (69.31g Ag/t, 0.26 g Au/t, 5.62% Zn and 1.92% Pb) over 26.67m in Mina 2.
Figure 3 is a plan map showing sampling results at Mina 1 and Mina 2. Table 6 gives details of the sampling results.
These results, along with the previously reported channel sample results from Porco noted above, clearly indicate that the Iska Iska mineralizing system extends much further south outside of the principal Iska Iska Caldera. Based on field work by the Eloro geological team, it appears that there may be a second, larger ringer structure with a diameter of approximately 4.6km outside the main Iska Iska caldera that could be another major focus of mineralization. This possibility is currently being explored by geological mapping and geophysical surveys to outline targets for drill-testing in conjunction with work in the Porco area and the nearby Mina Casiterita property.
Figure 1 – Geological Plan Map showing Drilling in Santa Barbara Area with Holes referred to in this release highlighted.
Figure 2: >90 g Ag eq/t Grade Shell Model and Magnetic Inverse Model, Santa Barbara Deposit; Comparison between the September 2022 Model and the Current Model
Figure 3: Plan Map Showing Channel Sample Results at Mina 1 and Mina 2, southern part of Iska Iska Property
Table 1: Significant Results, Definition Surface Diamond Drilling Huayra Kasa Area, Santa Barbara Deposit as at January 31, 2023.
| Hole No. | From (m) | To (m) | Length (m) | Ag | Au | Zn | Pb | Cu | Sn | Bi | Cd | Ag eq |
| g/t | g/t | % | % | % | % | % | % | g/t | ||||
| SANTA BARBARA DEFINITION DRILLING HUAYRA KASA AREA | ||||||||||||
| DHK-27 | 47.98 | 60.12 | 12.14 | 16.37 | 0.02 | 1.08 | 0.53 | 0.04 | 0.05 | 0.001 | 0.015 | 114.89 |
| 66.23 | 75.48 | 9.25 | 7.62 | 0.01 | 0.74 | 0.29 | 0.01 | 0.02 | 0.001 | 0.004 | 63.88 | |
| 93.30 | 418.78 | 325.48 | 69.80 | 0.03 | 1.21 | 0.49 | 0.07 | 0.12 | 0.003 | 0.006 | 202.43 | |
| 198.41 | 308.01 | 109.60 | 182.02 | 0.03 | 1.73 | 0.97 | 0.18 | 0.19 | 0.003 | 0.012 | 395.98 | |
| Incl. | 402.32 | 412.78 | 10.46 | 8.13 | 0.02 | 0.06 | 0.05 | 0.01 | 0.42 | 0.001 | 0.003 | 179.71 |
| 445.90 | 447.40 | 1.50 | 19.00 | 0.05 | 0.03 | 0.02 | 0.08 | 0.06 | 0.003 | 0.001 | 59.46 | |
| 451.92 | 453.42 | 1.50 | 25.00 | 0.02 | 0.04 | 0.01 | 0.05 | 0.04 | 0.010 | 0.001 | 54.00 | |
| 462.42 | 463.93 | 1.51 | 2.00 | 0.06 | 0.26 | 0.03 | 0.01 | 0.08 | 0.001 | 0.001 | 52.18 | |
| 471.48 | 480.52 | 9.04 | 6.50 | 0.04 | 0.14 | 0.02 | 0.02 | 0.11 | 0.001 | 0.002 | 64.38 | |
| 489.53 | 498.53 | 9.00 | 31.67 | 0.02 | 0.14 | 0.01 | 0.02 | 0.04 | 0.003 | 0.001 | 57.32 | |
| 522.54 | 530.11 | 7.57 | 16.55 | 0.06 | 0.11 | 0.02 | 0.04 | 0.05 | 0.034 | 0.001 | 57.16 | |
| 537.63 | 539.17 | 1.54 | 8.00 | 0.09 | 0.14 | 0.04 | 0.01 | 0.27 | 0.003 | 0.002 | 130.10 | |
| 567.88 | 595.12 | 27.24 | 13.07 | 0.17 | 0.25 | 0.05 | 0.08 | 0.07 | 0.006 | 0.001 | 81.02 | |
| 602.46 | 606.30 | 3.84 | 20.51 | 0.02 | 0.04 | 0.00 | 0.10 | 0.09 | 0.001 | 0.001 | 70.28 | |
| 621.60 | 624.70 | 3.10 | 14.48 | 0.11 | 0.17 | 0.01 | 0.06 | 0.03 | 0.004 | 0.002 | 51.77 | |
| 642.84 | 650.37 | 7.53 | 2.47 | 0.34 | 0.18 | 0.01 | 0.03 | 0.03 | 0.006 | 0.001 | 56.67 | |
| 683.66 | 686.63 | 2.97 | 5.01 | 0.12 | 0.12 | 0.01 | 0.11 | 0.06 | 0.045 | 0.001 | 67.91 | |
| DHK-26 | 38.50 | 40.00 | 1.50 | 45.40 | 0.01 | 1.90 | 1.13 | 0.02 | 0.01 | 0.001 | 0.013 | 181.01 |
| 61.34 | 64.39 | 3.05 | 0.50 | 0.73 | 0.12 | 0.01 | 0.00 | 0.00 | 0.023 | 0.001 | 79.04 | |
| 84.08 | 87.17 | 3.09 | 25.11 | 0.01 | 0.71 | 0.81 | 0.00 | 0.00 | 0.001 | 0.003 | 87.72 | |
| 91.74 | 93.23 | 1.49 | 12.80 | 0.02 | 1.00 | 0.44 | 0.01 | 0.00 | 0.001 | 0.004 | 80.14 | |
| 108.31 | 115.88 | 7.57 | 8.58 | 0.02 | 0.79 | 0.27 | 0.01 | 0.00 | 0.001 | 0.004 | 61.38 | |
| 126.47 | 131.04 | 4.57 | 8.74 | 0.14 | 0.59 | 0.24 | 0.03 | 0.00 | 0.001 | 0.004 | 62.57 | |
| 140.12 | 158.14 | 18.02 | 9.14 | 0.01 | 0.88 | 0.24 | 0.01 | 0.01 | 0.001 | 0.007 | 67.05 | |
| 164.23 | 167.22 | 2.99 | 5.10 | 0.02 | 0.72 | 0.16 | 0.00 | 0.01 | 0.001 | 0.005 | 50.53 | |
| 186.81 | 188.31 | 1.50 | 19.10 | 0.02 | 0.48 | 0.47 | 0.01 | 0.01 | 0.004 | 0.003 | 64.15 | |
| 198.90 | 200.37 | 1.47 | 89.80 | 0.22 | 5.36 | 2.59 | 0.07 | 0.02 | 0.005 | 0.034 | 472.73 | |
| 207.89 | 227.45 | 19.56 | 9.48 | 0.01 | 0.62 | 0.36 | 0.03 | 0.01 | 0.001 | 0.004 | 58.07 | |
| 301.44 | 302.95 | 1.51 | 6.50 | 0.01 | 1.92 | 0.21 | 0.01 | 0.01 | 0.001 | 0.007 | 112.05 | |
| 334.60 | 336.10 | 1.50 | 0.30 | 1.49 | 0.02 | 0.02 | 0.02 | 0.00 | 0.003 | 0.001 | 140.41 | |
| 376.82 | 385.83 | 9.01 | 1.14 | 0.01 | 1.58 | 0.42 | 0.01 | 0.00 | 0.001 | 0.004 | 96.07 | |
| 400.90 | 418.96 | 18.06 | 3.48 | 0.02 | 2.03 | 0.26 | 0.01 | 0.01 | 0.001 | 0.007 | 118.88 | |
| 524.38 | 527.39 | 3.01 | 7.00 | 0.03 | 1.73 | 0.27 | 0.01 | 0.01 | 0.001 | 0.008 | 107.71 | |
| 592.35 | 595.45 | 3.10 | 3.32 | 0.01 | 0.91 | 0.12 | 0.02 | 0.01 | 0.001 | 0.002 | 57.34 | |
| 729.40 | 783.30 | 53.90 | 28.44 | 0.09 | 3.11 | 0.26 | 0.04 | 0.05 | 0.003 | 0.013 | 222.51 | |
| Incl. | 751.84 | 759.26 | 7.42 | 89.75 | 0.21 | 6.23 | 0.83 | 0.07 | 0.09 | 0.008 | 0.027 | 486.82 |
| Incl. | 769.72 | 781.80 | 12.08 | 50.66 | 0.13 | 7.95 | 0.38 | 0.09 | 0.10 | 0.006 | 0.031 | 517.28 |
| 819.50 | 901.88 | 82.38 | 32.59 | 0.11 | 0.54 | 0.18 | 0.03 | 0.05 | 0.010 | 0.002 | 99.76 | |
| Incl. | 838.63 | 846.22 | 7.59 | 115.01 | 0.09 | 0.76 | 0.38 | 0.08 | 0.12 | 0.054 | 0.003 | 238.64 |
| Incl. | 853.72 | 861.24 | 7.52 | 149.42 | 0.27 | 0.49 | 0.41 | 0.07 | 0.13 | 0.019 | 0.002 | 273.63 |
| Incl. | 877.72 | 885.25 | 7.53 | 33.08 | 0.26 | 1.54 | 0.49 | 0.04 | 0.08 | 0.022 | 0.006 | 187.82 |
| 924.61 | 926.08 | 1.47 | 9.40 | 0.01 | 0.84 | 0.08 | 0.03 | 0.04 | 0.010 | 0.001 | 76.46 | |
| Hole No. | From (m) | To (m) | Length (m) | Ag | Au | Zn | Pb | Cu | Sn | Bi | Cd | Ag eq |
| g/t | g/t | % | % | % | % | % | % | g/t | ||||
| SANTA BARBARA DEFINITION DRILLING HUAYRA KASA AREA (CON’T) | ||||||||||||
| DHK-28 | 10.30 | 23.52 | 13.22 | 20.71 | 0.02 | 0.43 | 0.69 | 0.01 | 0.00 | 0.001 | 0.003 | 68.57 |
| 91.20 | 94.26 | 3.06 | 12.61 | 0.01 | 1.05 | 0.39 | 0.01 | 0.00 | 0.001 | 0.005 | 80.42 | |
| 97.20 | 98.77 | 1.57 | 7.00 | 0.01 | 1.03 | 0.21 | 0.01 | 0.01 | 0.001 | 0.006 | 69.07 | |
| 124.38 | 127.40 | 3.02 | 9.99 | 0.01 | 1.21 | 0.29 | 0.01 | 0.00 | 0.001 | 0.005 | 82.05 | |
| 138.02 | 147.04 | 9.02 | 13.48 | 0.02 | 1.01 | 0.34 | 0.02 | 0.00 | 0.001 | 0.004 | 78.26 | |
| 174.18 | 181.70 | 7.52 | 25.01 | 0.01 | 1.85 | 0.64 | 0.02 | 0.00 | 0.001 | 0.011 | 140.99 | |
| 207.58 | 210.62 | 3.04 | 5.43 | 0.01 | 0.65 | 0.09 | 0.02 | 0.01 | 0.002 | 0.002 | 49.22 | |
| 230.24 | 233.14 | 2.90 | 1.95 | 0.01 | 1.01 | 0.28 | 0.01 | 0.02 | 0.001 | 0.002 | 71.24 | |
| 275.62 | 278.49 | 2.87 | 3.95 | 0.01 | 1.22 | 1.09 | 0.01 | 0.02 | 0.001 | 0.004 | 107.09 | |
| 289.03 | 290.60 | 1.57 | 15.00 | 0.02 | 2.86 | 1.30 | 0.02 | 0.01 | 0.001 | 0.019 | 207.62 | |
| 361.79 | 363.31 | 1.52 | 6.00 | 0.05 | 1.05 | 0.03 | 0.02 | 0.03 | 0.001 | 0.005 | 78.99 | |
| 413.20 | 419.24 | 6.04 | 5.01 | 0.05 | 2.10 | 0.04 | 0.02 | 0.02 | 0.001 | 0.008 | 125.48 | |
| 488.78 | 490.23 | 1.45 | 4.00 | 0.01 | 0.99 | 0.02 | 0.01 | 0.01 | 0.001 | 0.003 | 58.37 | |
| 497.76 | 499.26 | 1.50 | 17.00 | 0.05 | 2.36 | 0.80 | 0.02 | 0.01 | 0.001 | 0.006 | 168.58 | |
| 536.99 | 540.05 | 3.06 | 8.49 | 0.01 | 2.30 | 0.48 | 0.03 | 0.04 | 0.001 | 0.010 | 155.33 | |
| 588.80 | 591.10 | 2.30 | 1.00 | 0.01 | 1.06 | 0.01 | 0.02 | 0.00 | 0.001 | 0.001 | 57.36 | |
| 604.96 | 608.03 | 3.07 | 25.80 | 0.02 | 2.35 | 0.03 | 0.17 | 0.15 | 0.001 | 0.008 | 224.29 | |
| 707.72 | 710.71 | 2.99 | 9.58 | 0.01 | 1.13 | 0.28 | 0.01 | 0.03 | 0.001 | 0.004 | 88.46 | |
| 728.88 | 870.44 | 141.56 | 26.26 | 0.07 | 0.35 | 0.33 | 0.02 | 0.04 | 0.006 | 0.001 | 79.22 | |
| Incl. | 734.70 | 758.55 | 23.85 | 67.00 | 0.05 | 0.55 | 1.30 | 0.02 | 0.05 | 0.005 | 0.002 | 162.77 |
| 878.04 | 881.07 | 3.03 | 8.26 | 0.10 | 0.54 | 0.10 | 0.08 | 0.09 | 0.004 | 0.001 | 92.98 | |
| 938.26 | 941.21 | 2.95 | 6.54 | 0.03 | 0.78 | 0.07 | 0.04 | 0.02 | 0.001 | 0.001 | 61.33 | |
| DHK-29 | 44.89 | 47.85 | 2.96 | 16.56 | 0.01 | 1.26 | 0.41 | 0.04 | 0.01 | 0.001 | 0.009 | 99.84 |
| 58.49 | 60.05 | 1.56 | 7.10 | 0.01 | 0.61 | 0.14 | 0.15 | 0.00 | 0.001 | 0.005 | 60.64 | |
| 108.42 | 114.40 | 3.05 | 1.66 | 0.01 | 2.13 | 0.29 | 0.01 | 0.01 | 0.001 | 0.009 | 120.39 | |
| 126.31 | 130.84 | 4.53 | 1.75 | 0.01 | 1.06 | 0.17 | 0.01 | 0.00 | 0.001 | 0.005 | 62.64 | |
| 206.30 | 227.60 | 21.30 | 19.10 | 0.07 | 2.29 | 0.27 | 0.06 | 0.05 | 0.011 | 0.009 | 176.28 | |
| 248.71 | 250.18 | 1.47 | 2.60 | 0.02 | 0.92 | 0.01 | 0.02 | 0.01 | 0.001 | 0.003 | 58.22 | |
| 277.40 | 280.52 | 3.12 | 4.70 | 0.02 | 0.88 | 0.01 | 0.01 | 0.01 | 0.002 | 0.004 | 56.98 | |
| 375.80 | 384.95 | 9.15 | 6.98 | 0.06 | 1.05 | 0.10 | 0.02 | 0.03 | 0.008 | 0.004 | 82.46 | |
| 407.25 | 410.20 | 2.95 | 2.79 | 0.01 | 0.91 | 0.01 | 0.01 | 0.01 | 0.001 | 0.003 | 54.76 | |
| 416.10 | 420.50 | 4.40 | 3.14 | 0.01 | 0.71 | 0.05 | 0.01 | 0.03 | 0.003 | 0.004 | 52.81 | |
| 441.70 | 443.16 | 1.46 | 3.50 | 0.01 | 1.23 | 0.04 | 0.01 | 0.01 | 0.001 | 0.006 | 70.33 | |
| 446.13 | 449.16 | 3.03 | 3.56 | 0.01 | 1.62 | 0.04 | 0.00 | 0.01 | 0.001 | 0.006 | 89.23 | |
| 488.40 | 489.93 | 1.53 | 2.00 | 0.08 | 0.65 | 0.09 | 0.02 | 0.02 | 0.001 | 0.002 | 55.96 | |
| 502.04 | 508.04 | 6.00 | 4.81 | 0.24 | 0.67 | 0.09 | 0.02 | 0.04 | 0.011 | 0.001 | 80.88 | |
| 521.65 | 523.17 | 1.52 | 3.50 | 0.03 | 1.43 | 0.05 | 0.01 | 0.01 | 0.003 | 0.006 | 84.21 | |
| 544.32 | 547.32 | 3.00 | 2.90 | 0.47 | 0.28 | 0.04 | 0.02 | 0.03 | 0.006 | 0.001 | 75.88 | |
| 596.90 | 598.36 | 1.46 | 29.50 | 0.03 | 3.44 | 0.19 | 0.01 | 0.04 | 0.001 | 0.018 | 224.90 | |
| 608.85 | 619.63 | 10.78 | 30.88 | 0.19 | 1.67 | 0.10 | 0.03 | 0.05 | 0.006 | 0.006 | 156.90 | |
| 650.69 | 655.18 | 4.49 | 7.15 | 0.05 | 0.78 | 0.02 | 0.01 | 0.02 | 0.005 | 0.002 | 61.49 | |
| 659.69 | 665.52 | 5.83 | 13.09 | 0.27 | 0.37 | 0.15 | 0.02 | 0.04 | 0.054 | 0.001 | 91.46 | |
| 689.78 | 698.81 | 9.03 | 5.31 | 0.09 | 0.51 | 0.13 | 0.02 | 0.03 | 0.007 | 0.001 | 57.66 | |
| 701.88 | 704.80 | 2.92 | 3.45 | 0.28 | 0.30 | 0.07 | 0.02 | 0.01 | 0.007 | 0.001 | 55.95 | |
| 712.35 | 713.82 | 1.47 | 16.30 | 0.06 | 0.02 | 0.02 | 0.01 | 0.02 | 0.115 | 0.001 | 56.82 | |
| 727.12 | 796.30 | 69.18 | 5.07 | 0.21 | 0.78 | 0.18 | 0.02 | 0.03 | 0.005 | 0.003 | 82.48 | |
| SANTA BARBARA DEFINITION DRILLING HUAYRA KASA AREA (CON’T) | ||||||||||||
| Hole No. | From (m) | To (m) | Length (m) | Ag | Au | Zn | Pb | Cu | Sn | Bi | Cd | Ag eq |
| g/t | g/t | % | % | % | % | % | % | g/t | ||||
| DHK-30 | 32.59 | 35.57 | 2.98 | 0.30 | 0.64 | 0.02 | 0.01 | 0.01 | 0.00 | 0.001 | 0.001 | 61.76 |
| 52.28 | 53.78 | 1.50 | 67.40 | 0.23 | 2.77 | 1.39 | 0.15 | 0.01 | 0.176 | 0.012 | 326.16 | |
| 91.38 | 92.86 | 1.48 | 38.90 | 0.02 | 1.35 | 0.77 | 0.03 | 0.01 | 0.012 | 0.008 | 141.03 | |
| 104.93 | 106.41 | 1.48 | 16.50 | 0.02 | 0.86 | 0.34 | 0.03 | 0.01 | 0.022 | 0.004 | 82.44 | |
| 136.52 | 144.06 | 7.54 | 17.63 | 0.19 | 1.13 | 0.34 | 0.04 | 0.02 | 0.004 | 0.005 | 113.69 | |
| 175.66 | 177.17 | 1.51 | 3.80 | 0.03 | 0.90 | 0.06 | 0.02 | 0.01 | 0.003 | 0.004 | 61.59 | |
| 189.21 | 199.78 | 10.57 | 4.04 | 0.05 | 1.01 | 0.07 | 0.03 | 0.02 | 0.001 | 0.004 | 69.44 | |
| 208.80 | 210.31 | 1.51 | 4.00 | 0.04 | 0.58 | 0.01 | 0.06 | 0.04 | 0.001 | 0.002 | 60.32 | |
| 219.36 | 220.88 | 1.52 | 7.60 | 0.02 | 1.46 | 0.03 | 0.04 | 0.03 | 0.001 | 0.007 | 99.88 | |
| 228.37 | 229.93 | 1.56 | 7.30 | 0.31 | 0.25 | 0.00 | 0.12 | 0.11 | 0.001 | 0.001 | 103.30 | |
| 243.51 | 246.56 | 3.05 | 2.71 | 0.24 | 0.75 | 0.01 | 0.02 | 0.01 | 0.002 | 0.002 | 70.08 | |
| 263.30 | 266.25 | 2.95 | 2.49 | 0.03 | 0.62 | 0.01 | 0.02 | 0.04 | 0.003 | 0.002 | 56.28 | |
| 275.35 | 278.36 | 3.01 | 3.20 | 0.01 | 0.77 | 0.01 | 0.02 | 0.02 | 0.001 | 0.003 | 54.26 | |
| 282.90 | 286.12 | 3.22 | 2.66 | 0.01 | 0.86 | 0.03 | 0.01 | 0.01 | 0.001 | 0.002 | 53.40 | |
| 301.30 | 302.80 | 1.50 | 2.50 | 0.02 | 1.29 | 0.01 | 0.01 | 0.02 | 0.001 | 0.005 | 76.23 | |
| 343.40 | 351.27 | 7.87 | 3.11 | 0.03 | 0.80 | 0.03 | 0.01 | 0.01 | 0.002 | 0.001 | 53.07 | |
| 382.93 | 389.01 | 6.08 | 14.31 | 0.43 | 0.86 | 0.10 | 0.01 | 0.03 | 0.019 | 0.004 | 116.22 | |
| 440.31 | 441.81 | 1.50 | 6.00 | 0.04 | 1.36 | 0.03 | 0.01 | 0.01 | 0.011 | 0.006 | 86.68 | |
| 512.65 | 515.62 | 2.97 | 2.74 | 0.03 | 0.59 | 0.11 | 0.00 | 0.04 | 0.001 | 0.002 | 55.43 | |
| 523.31 | 524.75 | 1.44 | 5.80 | 0.04 | 0.39 | 0.21 | 0.00 | 0.09 | 0.001 | 0.001 | 70.91 | |
| 549.28 | 553.81 | 4.53 | 4.17 | 0.01 | 0.49 | 0.04 | 0.01 | 0.09 | 0.001 | 0.002 | 65.33 | |
| 559.68 | 562.62 | 2.94 | 63.65 | 0.23 | 0.29 | 1.02 | 0.02 | 0.70 | 0.131 | 0.001 | 430.17 | |
| 576.51 | 578.03 | 1.52 | 2.20 | 0.01 | 0.06 | 0.25 | 0.01 | 0.15 | 0.001 | 0.001 | 72.78 | |
| 580.86 | 583.98 | 3.12 | 6.72 | 0.02 | 0.23 | 0.24 | 0.02 | 0.08 | 0.001 | 0.001 | 61.72 | |
| 588.52 | 591.57 | 3.05 | 13.03 | 0.06 | 0.16 | 0.09 | 0.05 | 0.08 | 0.005 | 0.001 | 69.16 | |
| 615.20 | 616.69 | 1.49 | 2.90 | 0.78 | 0.14 | 0.07 | 0.01 | 0.02 | 0.015 | 0.001 | 94.92 | |
| 636.28 | 637.83 | 1.55 | 4.30 | 0.01 | 0.73 | 0.28 | 0.02 | 0.06 | 0.002 | 0.004 | 75.65 | |
| 665.11 | 672.61 | 7.50 | 6.02 | 0.01 | 1.11 | 0.12 | 0.02 | 0.04 | 0.003 | 0.002 | 84.14 | |
| 683.04 | 686.14 | 3.10 | 2.31 | 0.02 | 1.63 | 0.22 | 0.06 | 0.08 | 0.005 | 0.002 | 129.03 | |
| 782.40 | 785.40 | 3.00 | 1.65 | 0.02 | 0.42 | 0.07 | 0.17 | 0.09 | 0.006 | 0.002 | 80.23 | |
| 791.40 | 794.39 | 2.99 | 1.23 | 0.01 | 0.80 | 0.30 | 0.03 | 0.02 | 0.002 | 0.001 | 62.58 | |
| DSB-42 | 51.71 | 54.70 | 2.99 | 3.03 | 4.59 | 0.63 | 0.15 | 0.02 | 0.01 | 0.168 | 0.002 | 494.23 |
| 62.31 | 63.84 | 1.53 | 1.00 | 0.02 | 1.10 | 0.33 | 0.03 | 0.00 | 0.001 | 0.003 | 72.15 | |
| 69.90 | 74.31 | 4.41 | 2.66 | 0.21 | 0.26 | 0.17 | 0.03 | 0.00 | 0.139 | 0.001 | 74.63 | |
| 130.30 | 139.36 | 6.06 | 10.15 | 0.12 | 0.81 | 0.12 | 0.02 | 0.01 | 0.015 | 0.006 | 74.15 | |
| 156.06 | 157.57 | 1.51 | 0.50 | 0.64 | 0.02 | 0.01 | 0.02 | 0.00 | 0.001 | 0.001 | 62.61 | |
| 193.85 | 195.42 | 1.57 | 13.00 | 0.15 | 1.04 | 0.51 | 0.01 | 0.01 | 0.001 | 0.005 | 98.83 | |
| 242.06 | 243.55 | 1.49 | 5.00 | 0.01 | 0.76 | 0.18 | 0.01 | 0.01 | 0.001 | 0.002 | 54.97 | |
| 317.45 | 318.96 | 1.51 | 5.00 | 0.04 | 2.19 | 0.14 | 0.01 | 0.01 | 0.001 | 0.011 | 126.24 | |
| 374.64 | 406.36 | 31.72 | 2.66 | 0.01 | 1.01 | 0.21 | 0.01 | 0.00 | 0.001 | 0.004 | 63.86 | |
| Incl. | 385.25 | 389.78 | 4.53 | 5.33 | 0.04 | 2.74 | 0.32 | 0.02 | 0.01 | 0.005 | 0.011 | 161.05 |
| 442.58 | 460.79 | 18.21 | 67.81 | 0.11 | 2.58 | 1.42 | 0.02 | 0.01 | 0.026 | 0.010 | 260.46 | |
| Incl. | 445.60 | 451.68 | 6.08 | 189.03 | 0.30 | 6.40 | 3.76 | 0.04 | 0.02 | 0.077 | 0.028 | 678.61 |
| 477.38 | 487.90 | 10.52 | 22.69 | 0.04 | 1.65 | 0.75 | 0.02 | 0.01 | 0.003 | 0.005 | 138.95 | |
| 519.62 | 561.79 | 42.17 | 7.19 | 0.07 | 1.83 | 0.48 | 0.01 | 0.02 | 0.008 | 0.006 | 130.69 | |
| Incl. | 519.62 | 533.11 | 13.49 | 17.53 | 0.13 | 3.97 | 1.31 | 0.01 | 0.04 | 0.002 | 0.014 | 283.75 |
| 575.22 | 576.74 | 1.52 | 1.00 | 0.01 | 1.05 | 0.08 | 0.01 | 0.00 | 0.001 | 0.004 | 57.83 | |
| 581.30 | 582.80 | 1.50 | 4.00 | 0.01 | 1.97 | 0.06 | 0.01 | 0.03 | 0.001 | 0.006 | 118.53 | |
| 596.33 | 668.64 | 72.31 | 19.71 | 0.03 | 1.50 | 0.57 | 0.01 | 0.04 | 0.003 | 0.006 | 129.98 | |
| Incl. | 634.00 | 668.64 | 34.64 | 33.10 | 0.04 | 2.37 | 1.00 | 0.01 | 0.06 | 0.001 | 0.010 | 208.42 |
| 685.15 | 763.25 | 78.10 | 1.75 | 0.08 | 0.67 | 0.13 | 0.02 | 0.02 | 0.001 | 0.002 | 57.11 | |
| Incl. | 742.49 | 755.70 | 13.21 | 2.95 | 0.08 | 1.61 | 0.30 | 0.01 | 0.05 | 0.004 | 0.005 | 120.06 |
| 814.88 | 817.75 | 2.87 | 0.75 | 0.02 | 0.87 | 0.08 | 0.01 | 0.02 | 0.001 | 0.001 | 57.61 | |
Note: True width of the mineralization is not known at the present time, but based on the current understanding of the relationship between drill orientation/inclination and the mineralization within the breccia pipes and the host rocks such as sandstones and dacites, it is estimated that true width ranges between 70% and 90% of the down hole interval length but this will be confirmed by further drilling and geological modelling.
Chemical symbols: Ag = silver, Au = gold, Zn = zinc, Pb = lead, Cu = copper, Sn = tin, Bi = bismuth, Cd = cadmium and g Ag eq/t = grams silver equivalent per tonne. Quantities are given in percent (%) for Zn, Pb Cu, Sn, Bi and Cd and in grams per tonne (g/t) for Ag, Au and Ag eq.
Metal prices and conversion factors used for calculation of g Ag eq/t (grams Ag per grams x metal ratio) are as follows (Prices updated as of July 21, 2022, to more accurately reflect current metal prices):
| Element | Price $US (per kg) | Ratio to Ag | |
| Ag | $607.00 | 1.0000 | |
| Sn | $23.55 | 0.0589 | |
| Zn | $2.98 | 0.0046 | |
| Pb | $1.92 | 0.0032 | |
| Au | $54,932.80 | 79.7221 | |
| Cu | $7.00 | 0.0134 | |
| Bi | $12.76 | 0.0177 | |
| Cd | $5.50 | 0.0076 | |
In calculating the intersections reported in this press release a sample cutoff of 30 g Ag eq/t was used with generally a maximum dilution of 3 continuous samples below cutoff included within a mineralized section unless more dilution is justified geologically.
The equivalent grade calculations are based on the stated metal prices and are provided for comparative purposes only, due to the polymetallic nature of the deposit. Metallurgical tests are in progress by Blue Coast Ltd. to establish levels of recovery for each element reported but currently the potential recovery for each element has not yet been established. While there is no assurance that all or any of the reported concentrations of metals will be recoverable, Bolivia has a long history of successfully mining and processing similar polymetallic deposits which is well documented in the landmark volume “Yacimientos Metaliferos de Bolivia” by Dr. Osvaldo R. Arce Burgoa, P.Geo.
Table 2: Significant Results, Definition Surface Diamond Drilling Southwestern and South-Southeastern Extensions Santa Barbara Deposit as at January 31, 2023.
| Hole No. | From (m) | To (m) | Length (m) | Ag | Au | Zn | Pb | Cu | Sn | Bi | Cd | Ag eq |
| g/t | g/t | % | % | % | % | % | % | g/t | ||||
| SANTA BARBARA DRILLING SOUTHWESTERN EXTENSION | ||||||||||||
| DSB-43 | 43.86 | 56.02 | 12.16 | 15.01 | 0.04 | 0.01 | 0.03 | 0.01 | 0.09 | 0.001 | 0.001 | 56.74 |
| 157.55 | 163.60 | 6.05 | 18.05 | 0.21 | 0.12 | 0.16 | 0.03 | 0.10 | 0.020 | 0.001 | 93.89 | |
| 185.44 | 192.80 | 7.36 | 6.80 | 0.02 | 0.01 | 0.05 | 0.06 | 0.09 | 0.003 | 0.001 | 52.42 | |
| 213.80 | 236.94 | 23.14 | 6.21 | 0.10 | 0.00 | 0.02 | 0.00 | 0.17 | 0.011 | 0.001 | 82.61 | |
| 262.08 | 265.00 | 2.92 | 0.30 | 0.03 | 0.00 | 0.00 | 0.07 | 0.16 | 0.017 | 0.001 | 74.55 | |
| 278.62 | 283.43 | 4.81 | 2.19 | 0.02 | 0.00 | 0.01 | 0.01 | 0.17 | 0.004 | 0.001 | 71.93 | |
| 295.41 | 304.60 | 9.19 | 1.50 | 0.03 | 0.00 | 0.02 | 0.00 | 0.11 | 0.005 | 0.001 | 50.40 | |
| 321.13 | 327.30 | 6.17 | 4.23 | 0.01 | 0.00 | 0.03 | 0.58 | 0.08 | 0.001 | 0.001 | 103.98 | |
| 378.85 | 380.41 | 1.56 | 1.90 | 0.01 | 0.00 | 0.03 | 0.11 | 0.11 | 0.003 | 0.001 | 60.77 | |
| 386.30 | 398.38 | 12.08 | 4.10 | 0.03 | 0.00 | 0.05 | 0.01 | 0.29 | 0.014 | 0.001 | 126.39 | |
| 434.28 | 463.03 | 28.75 | 58.77 | 0.04 | 0.12 | 0.08 | 0.10 | 0.11 | 0.028 | 0.001 | 128.40 | |
| Incl. | 438.90 | 455.50 | 16.60 | 94.23 | 0.05 | 0.11 | 0.11 | 0.15 | 0.14 | 0.046 | 0.001 | 190.20 |
| 573.46 | 574.94 | 1.48 | 16.20 | 0.45 | 0.11 | 0.10 | 0.01 | 0.09 | 0.012 | 0.001 | 104.61 | |
| 596.10 | 612.66 | 16.56 | 60.05 | 0.10 | 0.07 | 0.01 | 0.02 | 0.02 | 0.003 | 0.001 | 82.12 | |
| 627.74 | 635.22 | 7.48 | 5.70 | 0.19 | 0.71 | 0.16 | 0.02 | 0.02 | 0.011 | 0.005 | 76.77 | |
| 650.28 | 665.30 | 15.02 | 16.83 | 0.14 | 0.30 | 0.26 | 0.02 | 0.12 | 0.016 | 0.001 | 103.50 | |
| 761.80 | 767.87 | 6.07 | 6.63 | 0.07 | 0.02 | 0.09 | 0.05 | 0.05 | 0.108 | 0.001 | 66.16 | |
| 805.24 | 806.76 | 1.52 | 6.00 | 0.12 | 0.06 | 0.01 | 0.10 | 0.10 | 0.116 | 0.001 | 94.19 | |
| 829.25 | 833.10 | 3.85 | 8.43 | 0.02 | 0.05 | 0.01 | 0.11 | 0.08 | 0.031 | 0.001 | 64.65 | |
| SANTA BARBARA DRILLING SOUTH-SOUTHEASTERN EXTENSION | ||||||||||||
| DSB-46 | 87.15 | 88.70 | 1.55 | 1.40 | 0.01 | 0.84 | 0.05 | 0.09 | 0.00 | 0.001 | 0.003 | 56.17 |
| 114.31 | 115.85 | 1.54 | 5.60 | 0.23 | 1.76 | 0.28 | 0.08 | 0.00 | 0.001 | 0.006 | 133.06 | |
| 145.05 | 146.57 | 1.52 | 2.30 | 0.01 | 0.65 | 0.05 | 0.27 | 0.00 | 0.001 | 0.003 | 69.08 | |
| 170.65 | 172.19 | 1.54 | 16.00 | 0.76 | 7.76 | 0.83 | 0.46 | 0.00 | 0.001 | 0.030 | 548.36 | |
| 218.84 | 220.37 | 1.53 | 8.90 | 0.23 | 4.65 | 0.17 | 0.05 | 0.01 | 0.003 | 0.017 | 273.50 | |
| 277.60 | 279.11 | 1.51 | 3.10 | 0.07 | 1.40 | 0.11 | 0.05 | 0.01 | 0.001 | 0.006 | 90.90 | |
| 325.80 | 351.50 | 25.70 | 8.05 | 0.03 | 1.24 | 0.18 | 0.05 | 0.01 | 0.003 | 0.008 | 85.82 | |
| 360.48 | 362.01 | 1.53 | 4.10 | 0.32 | 0.23 | 0.06 | 0.07 | 0.00 | 0.013 | 0.001 | 57.77 | |
| 365.05 | 371.09 | 6.04 | 7.71 | 0.58 | 0.38 | 0.08 | 0.19 | 0.00 | 0.020 | 0.002 | 108.11 | |
| 383.11 | 384.62 | 1.51 | 6.80 | 0.04 | 0.70 | 0.20 | 0.02 | 0.01 | 0.001 | 0.005 | 56.05 | |
| 401.27 | 402.80 | 1.53 | 2.20 | 0.14 | 0.60 | 0.08 | 0.03 | 0.00 | 0.001 | 0.003 | 51.49 | |
| 405.84 | 407.30 | 1.46 | 4.80 | 0.06 | 0.62 | 0.18 | 0.01 | 0.01 | 0.001 | 0.003 | 50.23 | |
| 416.42 | 422.49 | 6.07 | 7.28 | 0.15 | 1.37 | 0.18 | 0.03 | 0.00 | 0.001 | 0.009 | 100.10 | |
| 434.59 | 437.55 | 2.96 | 4.92 | 0.02 | 0.94 | 0.11 | 0.01 | 0.00 | 0.001 | 0.004 | 59.21 | |
| 442.16 | 446.66 | 4.50 | 9.55 | 0.07 | 1.43 | 0.21 | 0.01 | 0.00 | 0.001 | 0.008 | 96.18 | |
| 460.25 | 478.47 | 18.22 | 6.95 | 0.10 | 1.34 | 0.20 | 0.03 | 0.01 | 0.001 | 0.009 | 93.84 | |
| 484.57 | 485.98 | 1.41 | 7.50 | 0.01 | 2.15 | 0.20 | 0.01 | 0.01 | 0.001 | 0.016 | 125.15 | |
| 504.15 | 537.65 | 33.50 | 5.83 | 0.04 | 1.75 | 0.12 | 0.02 | 0.01 | 0.001 | 0.010 | 107.44 | |
| Incl. | 510.18 | 520.95 | 10.77 | 6.58 | 0.07 | 2.20 | 0.14 | 0.03 | 0.02 | 0.001 | 0.013 | 137.05 |
| Incl. | 531.58 | 537.65 | 6.07 | 15.28 | 0.05 | 4.39 | 0.26 | 0.04 | 0.02 | 0.001 | 0.025 | 257.17 |
| 542.13 | 543.64 | 1.51 | 2.40 | 0.08 | 0.86 | 0.06 | 0.02 | 0.01 | 0.001 | 0.006 | 59.16 | |
| 570.73 | 572.31 | 1.58 | 8.70 | 0.14 | 1.36 | 0.24 | 0.01 | 0.01 | 0.002 | 0.005 | 102.13 | |
| 602.40 | 611.42 | 9.02 | 0.12 | 0.02 | 0.07 | 1.09 | 0.00 | 0.01 | 0.004 | 0.000 | 43.33 | |
| 646.17 | 647.66 | 1.49 | 25.60 | 0.02 | 1.11 | 0.77 | 0.04 | 0.03 | 0.001 | 0.005 | 121.36 | |
| 664.18 | 665.70 | 1.52 | 12.00 | 0.52 | 1.99 | 0.21 | 0.02 | 0.01 | 0.004 | 0.010 | 171.30 | |
| 688.55 | 690.07 | 1.52 | 11.60 | 0.36 | 1.27 | 0.30 | 0.05 | 0.01 | 0.003 | 0.008 | 125.92 | |
| 718.90 | 720.41 | 1.51 | 17.70 | 0.90 | 0.25 | 0.05 | 0.02 | 0.02 | 0.003 | 0.001 | 125.06 | |
| 730.92 | 732.43 | 1.51 | 7.20 | 0.01 | 0.94 | 0.17 | 0.00 | 0.03 | 0.001 | 0.005 | 73.23 | |
| 764.37 | 765.88 | 1.51 | 39.40 | 0.29 | 3.22 | 2.02 | 0.01 | 0.31 | 0.004 | 0.017 | 409.92 | |
| 768.86 | 770.43 | 1.57 | 4.20 | 0.02 | 0.88 | 0.14 | 0.01 | 0.01 | 0.001 | 0.006 | 59.82 | |
| 784.00 | 785.50 | 1.50 | 5.00 | 0.26 | 1.55 | 0.04 | 0.01 | 0.05 | 0.005 | 0.011 | 127.82 | |
| 811.15 | 812.70 | 1.55 | 1.30 | 0.12 | 0.66 | 0.08 | 0.02 | 0.01 | 0.001 | 0.003 | 51.79 | |
See Note Table 1.
Table 3: Summary of Diamond Drill Holes Completed with Assays Pending at Iska Iska from January 31, 2023, press release.
| SUMMARY DIAMOND DRILLING ISKA ISKA | |||||||
| Hole No. | Type | Collar Easting | Collar Northing | Elev. | Azimuth | Angle | Hole Length (m) |
| Surface Drilling Santa Barbara Resource Definition South-Southeast Extension | |||||||
| DSB-44 | S | 205611 | 7655625 | 4076 | 225° | -60° | 964.1 |
| DSB-45 | S | 205263 | 7656426 | 4240 | 225° | -60° | 836.4 |
| DSB-47 | S | 205370 | 7656108 | 4227 | 225° | -60° | 1,001.4 |
| DSB-48 | S | 205752 | 7655483 | 4054 | 225° | -60° | 821.4 |
| DSB-49 | S | 205894 | 7655911 | 4017 | 225° | -60° | 830.4 |
| DSB-50 | S | 205965 | 7655841 | 4016 | 225° | -55° | 854.4 |
| DSB-51 | S | 205894 | 7655628 | 4028 | 225° | -60° | 803.4 |
| DSB-52 | S | 205965 | 7655558 | 4002 | 225° | -60° | 824.4 |
| TOTAL | 6,935.9 | ||||||
S = Surface UG = Underground; collar coordinates in meters; azimuth and dip in degrees. Total drilling completed since the start of the program on September 20, 2020 to the completion of the Santa Barbara definition drill program on November 27, 2022 is 84,495m in 122 drill holes (32 underground drill holes and 90 surface drill holes).
Table 4: Channel Sampling Results, Mina 1.
| CHANNEL SAMPLING RESULTS – MINA 1 | |||||||||
| SAMPLE No. | Distance between samples (m) | Channel Width (m) | Ag g/t | Au g/t | Zn % | Pb % | Sn % | Ag eq g/t* | |
| M1-14 | 12.84 | 2.14 | 0.01 | 1.00 | 0.02 | 0.01 | 0.02 | 14.26 | |
| M1-15 | 5.69 | 1.81 | 0.01 | 0.50 | 0.01 | 0.00 | 0.01 | 7.93 | |
| M1-16 | 5.84 | 1.46 | 0.01 | 0.50 | 0.01 | 0.00 | 0.01 | 12.25 | |
| M1-17 | 4.94 | 2.12 | 0.01 | 4.00 | 0.05 | 0.02 | 0.05 | 52.53 | |
| M1-19 | 3.71 | 1.65 | 0.01 | 1.00 | 0.01 | 0.00 | 0.01 | 6.65 | |
| M1-20 | 6.32 | 2.30 | 0.01 | 3.00 | 0.03 | 0.04 | 0.03 | 33.20 | |
| M1-21 | 5.10 | 2.00 | 0.01 | 1.00 | 0.07 | 0.02 | 0.07 | 49.85 | |
| M1-22 | 4.59 | 1.52 | 0.01 | 3.00 | 0.07 | 0.05 | 0.07 | 53.44 | |
| M1-23 | 3.83 | 1.62 | 0.01 | 34.00 | 0.12 | 1.03 | 0.12 | 152.55 | |
| M1-25 | 3.41 | 2.08 | 0.97 | 197.00 | 0.19 | 0.49 | 0.19 | 467.14 | |
| M1-01 | 4.38 | 1.20 | 383.00 | 0.54 | 5.90 | 0.63 | 0.33 | 918.09 | Avg-01* |
| M1-40 | 4.38 | 2.60 | 427.00 | 0.49 | 6.78 | 0.63 | 0.33 | 1002.63 | |
| M1-02 | 4.70 | 2.74 | 149.00 | 0.10 | 1.08 | 0.23 | 0.08 | 265.68 | Avg-02* |
| M1-41 | 4.70 | 1.42 | 174.00 | 0.09 | 0.95 | 0.23 | 0.12 | 305.07 | |
| M1-03 | 5.36 | 1.50 | 0.61 | 267.00 | 0.18 | 0.40 | 0.18 | 541.76 | |
| M1-04 | 3.53 | 1.17 | 0.91 | 290.00 | 0.26 | 0.66 | 0.26 | 689.08 | |
| M1-05 | 6.78 | 1.37 | 0.16 | 54.00 | 0.08 | 0.22 | 0.08 | 142.87 | |
| M1-26 | 4.19 | 2.76 | 0.04 | 84.00 | 0.17 | 0.03 | 0.17 | 210.81 | |
| M1-27 | 3.77 | 2.89 | 0.07 | 21.00 | 0.03 | 0.02 | 0.03 | 50.58 | |
| M1-28 | 3.86 | 1.97 | 0.04 | 31.00 | 0.05 | 0.04 | 0.05 | 71.14 | |
| M1-29 | 2.85 | 1.82 | 0.01 | 17.00 | 0.03 | 0.24 | 0.03 | 68.45 | |
| M1-30 | 5.50 | 2.58 | 0.01 | 4.00 | 0.02 | 0.02 | 0.02 | 34.43 | |
| M1-31 | 4.46 | 1.90 | 0.01 | 1.00 | 0.00 | 0.00 | 0.00 | 5.11 | |
| M1-32 | 4.53 | 1.60 | 0.01 | 2.00 | 0.03 | 0.01 | 0.03 | 23.56 | |
| M1-06 | 6.51 | 1.10 | 13.00 | 0.02 | 0.34 | 0.07 | 0.04 | 59.11 | Avg-03* |
| M1-07 | 6.51 | 0.98 | 158.00 | 0.03 | 7.22 | 0.48 | 0.12 | 581.92 | |
| M1-09 | 6.51 | 0.72 | 42.00 | 0.11 | 0.08 | 0.04 | 0.18 | 171.70 | |
| M1-33 | 6.51 | 2.25 | 4.00 | 0.01 | 0.07 | 0.08 | 0.16 | 105.88 | |
| M1-35 | 6.51 | 1.96 | 21.00 | 0.03 | 0.54 | 0.06 | 0.14 | 135.55 | |
| M1-36 | 6.51 | 1.93 | 22.00 | 0.06 | 0.09 | 0.03 | 0.08 | 85.12 | |
| M1-42 | 6.51 | 1.73 | 89.00 | 0.10 | 3.10 | 0.17 | 0.11 | 316.37 | |
| M1-10 | 4.24 | 1.60 | 0.04 | 49.00 | 0.12 | 0.19 | 0.12 | 189.44 | |
| M1-11 | 7.08 | 1.56 | 0.05 | 70.00 | 0.21 | 0.47 | 0.21 | 280.27 | |
| M1-12 | 3.85 | 1.72 | 0.03 | 29.00 | 0.12 | 0.10 | 0.12 | 118.70 | |
| M1-13 | 5.53 | 1.42 | 0.01 | 3.00 | 0.12 | 0.07 | 0.12 | 79.06 | |
| M1-38 | 3.97 | 1.95 | 0.01 | 1.00 | 0.10 | 0.03 | 0.10 | 60.30 | |
| M1-39 | 4.60 | 1.08 | 0.01 | 1.00 | 0.00 | 0.00 | 0.00 | 3.48 | |
| Avg-01* | 4.38 | 2.60 | 383.00 | 405.00 | 6.34 | 0.63 | 0.33 | 960.36 | |
| Avg-02* | 4.7 | 2.74 | 161.50 | 0.10 | 1.01 | 0.23 | 0.10 | 285.38 | |
| Avg-03* | 6.51 | 10.67 | 49.86 | 0.05 | 1.64 | 0.13 | 0.12 | 207.95 | |
| Right Wall | Distance between samples (m) | Channel length (m) | Ag g/t | Au g/t | Zn % | Pb % | Sn % | Ag eq g/t* | |
| 145.95 | 63.60 | 55.03 | 0.11 | 0.70 | 0.16 | 0.08 | 153.94 | ||
| Note. Ag equivalent calculation is based on prices in July 21, 2022 press release. | |||||||||
| Weighted average grade | |||||||||
| Avg-01* | M1-01 and M1-40 | ||||||||
| Avg-02* | M1-02 and M1-41 | ||||||||
| Avg-03* | M1-06; M1-07; M1-09; M1-33; M1-35; M1-36; M1-42 | ||||||||
Note: See Table 1 for metal prices used to calculate g Ag eq/t.
Table 5: Channel Sampling Results, Mina 2.
| CHANNEL SAMPLING RESULTS – MINA 2 | |||||||||
| Sample No. | Channel Width (m) | Distance between samples (m) | Ag g/t | Au g/t | Zn % | Pb % | Sn % | Ag eq g/t* | |
| M2-81 | 1.41 | 3.81 | 2.00 | 0.01 | 0.47 | 0.06 | 0.01 | 31.49 | |
| M2-82 | 1.83 | 3.78 | 1.00 | 0.01 | 0.08 | 0.03 | 0.01 | 11.02 | |
| M2-39 | 0.85 | 3.93 | 1.00 | 0.01 | 0.59 | 0.14 | 0.02 | 41.81 | |
| M2-83 | 1.45 | 4.89 | 0.30 | 0.01 | 0.05 | 0.01 | 0.01 | 5.98 | |
| M2-84 | 1.40 | 4.39 | 0.30 | 0.01 | 0.01 | 0.00 | 0.01 | 4.17 | |
| M2-85 | 1.57 | 5.09 | 0.30 | 0.01 | 0.01 | 0.00 | 0.00 | 2.80 | |
| M2-09 | 2.00 | 4.45 | 1.00 | 0.01 | 0.08 | 0.03 | 0.01 | 10.04 | |
| M2-10 | 2.00 | 2.07 | 1.00 | 0.01 | 0.08 | 0.03 | 0.01 | 11.43 | |
| M2-11 | 1.67 | 1.63 | 1.00 | 0.91 | 0.46 | 0.17 | 0.02 | 213.75 | |
| M2-12 | 2.00 | 2.90 | 1.00 | 0.19 | 0.12 | 0.04 | 0.01 | 30.06 | |
| M2-103 | 1.32 | 4.83 | 1.00 | 0.01 | 0.01 | 0.00 | 0.01 | 6.19 | |
| M2-104 | 1.64 | 4.83 | 2.00 | 0.01 | 0.52 | 0.06 | 0.00 | 31.68 | |
| M2-105 | 1.78 | 4.05 | 1.00 | 0.01 | 0.23 | 0.03 | 0.05 | 34.23 | |
| M2-106 | 1.78 | 3.54 | 1.00 | 0.01 | 0.07 | 0.02 | 0.01 | 8.68 | |
| M2-107 | 1.45 | 3.92 | 0.30 | 0.01 | 0.01 | 0.00 | 0.01 | 3.74 | |
| M2-108 | 1.27 | 5.81 | 0.30 | 0.01 | 0.01 | 0.00 | 0.01 | 5.69 | |
| M2-109 | 1.65 | 5.99 | 1.00 | 0.01 | 0.10 | 0.04 | 0.01 | 9.80 | |
| M2-110 | 1.70 | 4.66 | 0.30 | 0.01 | 0.02 | 0.00 | 0.00 | 3.32 | |
| M2-111 | 1.51 | 4.40 | 0.30 | 0.01 | 0.04 | 0.01 | 0.01 | 5.75 | |
| M2-40 | 0.40 | 3.72 | 98.00 | 0.01 | 3.35 | 4.16 | 0.01 | 400.95 | |
| M2-112 | 1.73 | 4.37 | 0.30 | 0.01 | 0.01 | 0.00 | 0.00 | 3.22 | |
| M2-41 | 0.64 | 2.41 | 1.00 | 0.01 | 0.06 | 0.03 | 0.01 | 8.05 | |
| M2-43 | 0.40 | 0.55 | 12.00 | 0.01 | 2.17 | 0.50 | 0.01 | 138.50 | |
| M2-44 | 0.60 | 1.87 | 1.00 | 0.01 | 0.19 | 0.04 | 0.00 | 13.58 | |
| M2-113 | 1.66 | 4.12 | 1.00 | 0.01 | 0.10 | 0.01 | 0.00 | 9.13 | |
| M2-114 | 1.56 | 3.97 | 2.00 | 0.01 | 0.34 | 0.02 | 0.00 | 21.66 | |
| M2-116 | 1.67 | 4.09 | 5.00 | 0.01 | 0.38 | 0.07 | 0.01 | 34.95 | |
| M2-117 | 1.26 | 4.04 | 7.00 | 0.01 | 1.54 | 0.19 | 0.01 | 94.95 | |
| M2-118 | 0.85 | 3.76 | 2.00 | 0.01 | 0.26 | 0.08 | 0.01 | 23.27 | |
| M2-119 | 1.23 | 3.95 | 7.00 | 0.01 | 1.00 | 0.40 | 0.01 | 73.55 | |
| Weighted average grade | 115.81 | 4.64 | 0.02 | 0.34 | 0.18 | 0.01 | 34.94 | ||
| M2-34 | 0.90 | 4.07 | 1.00 | 0.01 | 0.83 | 0.03 | 0.01 | 49.98 | Avg-01* |
| M2-36 | 0.35 | 4.07 | 128.00 | 0.07 | 3.91 | 0.72 | 0.35 | 648.64 | |
| M2-37 | 0.69 | 4.07 | 1.00 | 0.01 | 0.05 | 0.01 | 0.01 | 7.96 | |
| M2-65 | 2.00 | 4.07 | 29.00 | 0.02 | 0.95 | 0.17 | 0.14 | 178.81 | |
| M2-67 | 1.33 | 3.90 | 32.00 | 0.44 | 0.95 | 0.37 | 0.03 | 160.50 | |
| M2-68 | 1.18 | 1.32 | 2.00 | 0.04 | 0.05 | 0.02 | 0.01 | 16.55 | |
| M2-69 | 1.13 | 2.97 | 2.00 | 0.01 | 0.01 | 0.00 | 0.01 | 17.83 | |
| Weighted average grade | 3.95 | 24.08 | 0.16 | 0.79 | 0.20 | 0.06 | 130.66 | ||
| M2-89 | 1.27 | 1.76 | 6.00 | 0.01 | 0.78 | 0.12 | 0.01 | 52.82 | |
| M2-05 | 1.65 | 3.83 | 1.00 | 1.75 | 1.13 | 0.23 | 0.03 | 244.34 | |
| M2-88 | 3.50 | 3.89 | 9.00 | 0.39 | 0.70 | 0.28 | 0.08 | 124.27 | |
| M2-06 | 1.33 | 3.82 | 1.00 | 4.20 | 0.28 | 0.10 | 0.01 | 435.80 | |
| M2-87 | 2.20 | 3.61 | 2.00 | 1.33 | 0.51 | 0.16 | 0.02 | 164.51 | |
| M2-08 | 1.27 | 4.56 | 12.00 | 0.46 | 2.02 | 0.60 | 0.02 | 187.61 | |
| M2-86 | 3.50 | 4.36 | 1.00 | 0.52 | 0.21 | 0.06 | 0.01 | 69.60 | |
| M2-13 | 1.37 | 4.89 | 21.00 | 1.50 | 2.72 | 0.75 | 0.02 | 696.20 | |
| M2-91 | 2.56 | 4.07 | 20.00 | 0.28 | 0.74 | 0.53 | 0.03 | 166.64 | |
| M2-14 | 1.62 | 3.90 | 5.00 | 1.52 | 3.12 | 0.65 | 0.03 | 459.88 | |
| M2-92 | 1.57 | 3.92 | 14.00 | 3.08 | 1.45 | 0.60 | 0.01 | 487.86 | |
| M2-16 | 1.23 | 3.33 | 30.00 | 4.77 | 3.46 | 2.13 | 0.04 | 969.42 | |
| M2-93 | 1.48 | 3.13 | 28.00 | 10.20 | 3.70 | 1.35 | 0.04 | 1305.70 | |
| M2-17 | 1.45 | 3.74 | 46.00 | 0.27 | 3.16 | 2.28 | 0.07 | 351.99 | |
| M2-94 | 2.13 | 3.31 | 33.00 | 0.68 | 8.84 | 1.73 | 0.04 | 627.02 | |
| M2-18 | 1.40 | 3.87 | 26.00 | 0.92 | 3.52 | 1.61 | 0.02 | 345.00 | |
| M2-95 | 2.24 | 4.76 | 6.00 | 0.09 | 2.27 | 0.13 | 0.02 | 141.32 | |
| M2-96 | 1.59 | 3.77 | 26.00 | 0.43 | 1.78 | 0.56 | 0.02 | 210.69 | |
| Weighted average grade | 68.53 | 15.67 | 1.70 | 2.20 | 0.75 | 0.03 | 382.79 | ||
| M2-97 | 1.20 | 5.73 | 0.30 | 0.01 | 0.04 | 0.01 | 0.00 | 7.17 | |
| M2-98 | 1.52 | 3.88 | 2.00 | 0.01 | 0.67 | 0.05 | 0.00 | 39.59 | |
| M2-99 | 1.35 | 3.00 | 7.00 | 0.01 | 1.14 | 0.26 | 0.01 | 82.92 | |
| Weighted average grade | 12.61 | 2.42 | 0.01 | 0.49 | 0.08 | 0.00 | 35.16 | ||
| M2-100 | 1.50 | 3.71 | 31.00 | 0.01 | 5.58 | 0.81 | 0.01 | 342.47 | |
| M2-101 | 1.60 | 2.63 | 76.00 | 0.10 | 5.88 | 2.89 | 0.03 | 486.13 | |
| M2-02 | 1.57 | 5.28 | 28.00 | 0.10 | 2.19 | 1.22 | 0.02 | 210.15 | |
| M2-03 | 1.15 | 8.95 | 120.00 | 0.66 | 6.30 | 2.89 | 0.09 | 680.10 | |
| M2-01 | 1.45 | 3.06 | 66.00 | 0.03 | 8.91 | 1.87 | 0.05 | 589.72 | |
| M2-04 | 1.36 | 3.03 | 36.00 | 0.01 | 6.08 | 0.88 | 0.02 | 374.13 | |
| Weighted average grade | 26.67 | 69.31 | 0.26 | 5.62 | 1.92 | 0.05 | 475.78 | ||
| Avg-01* | 2.00 | 4.07 | 39.75 | 0.03 | 1.43 | 0.23 | 0.13 | 221.35 | |
| *Note. Ag equivalent calculation is based on prices in July 21, 2022 press release. | |||||||||
| Weighted average grade | |||||||||
| Avg-01* | M2-34; M2-36; M2-37; M2-65 | ||||||||
Note: See Table 1 for metal prices used to calculate g Ag eq/t.
Qualified Person
Dr. Osvaldo Arce, P.Geo., General Manager of Eloro’s Bolivian subsidiary, Minera Tupiza S.R.L., and a Qualified Person in the context of NI 43-101, has reviewed and approved the technical content of this news release. Dr. Bill Pearson, P.Geo., Executive Vice President Exploration Eloro, and who has more than 45 years of worldwide mining exploration experience, including extensive work in South America, manages the overall technical program, working closely with Dr. Osvaldo Arce, P.Geo. Dr. Quinton Hennigh, P.Geo., Senior Technical Advisor to Eloro and Independent Technical Advisor, Mr. Charley Murahwi P.Geo., FAusIMM of Micon are regularly consulted on technical aspects of the project.
Eloro is utilizing both ALS and AHK for drill core analysis, both of whom are major international accredited laboratories. Drill samples sent to ALS are prepared in both ALS Bolivia Ltda’s preparation facility in Oruro, Bolivia and the preparation facility operated by AHK in Tupiza with pulps sent to the main ALS Global laboratory in Lima for analysis. More recently Eloro has had ALS send pulps to their laboratory at Galway in Ireland. Eloro employs an industry standard QA/QC program with standards, blanks and duplicates inserted into each batch of samples analyzed with selected check samples sent to a separate accredited laboratory.
Drill core samples sent to AHK Laboratories are prepared in a preparation facility installed and managed by AHK in Tupiza with pulps sent to the AHK laboratory in Lima, Peru. Au and Sn analysis on these samples is done by ALS Bolivia Ltda in Lima. Check samples between ALS and AHK are regularly done as a QA/QC check. AHK is following the same analytical protocols used as with ALS and with the same QA/QC protocols. Turnaround time continues to improve, as laboratories return to more normal staffing levels.
About Iska Iska
Iska Iska silver-tin polymetallic project is a road accessible, royalty-free property, wholly controlled by the Title Holder, Empresa Minera Villegas S.R.L. and is located 48 km north of Tupiza city, in the Sud Chichas Province of the Department of Potosi in southern Bolivia. Eloro has an option to earn a 100% interest in Iska Iska.
Iska Iska is a major silver-tin polymetallic porphyry-epithermal complex associated with a Miocene possibly collapsed/resurgent caldera, emplaced on Ordovician age rocks with major breccia pipes, dacitic domes and hydrothermal breccias. The caldera is 1.6km by 1.8km in dimension with a vertical extent of at least 1km. Mineralization age is similar to Cerro Rico de Potosí and other major deposits such as San Vicente, Chorolque, Tasna and Tatasi located in the same geological trend.
Eloro began underground diamond drilling from the Huayra Kasa underground workings at Iska Iska on September 13, 2020. On November 18, 2020, Eloro announced the discovery of a significant breccia pipe with extensive silver polymetallic mineralization just east of the Huayra Kasa underground workings and a high-grade gold-bismuth zone in the underground workings. On November 24, 2020, Eloro announced the discovery of the SBBP approximately 150m southwest of the Huayra Kasa underground workings.
Subsequently, on January 26, 2021, Eloro announced significant results from the first drilling at the SBBP including the discovery hole DHK-15 which returned 129.60 g Ag eq/t over 257.5m (29.53g Ag/t, 0.078 g Au/t, 1.45%Zn, 0.59%Pb, 0.080%Cu, 0.056%Sn, 0.0022%In and 0.0064% Bi from 0.0m to 257.5m). Subsequent drilling has confirmed significant values of Ag-Sn polymetallic mineralization in the SBBP and the adjacent CBP. A substantive mineralized envelope which is open along strike and down-dip extends around both major breccia pipes. Continuous channel sampling of the Santa Barbara Adit located to the east of SBBP returned 442 g Ag eq/t (164.96 g Ag/t, 0.46%Sn, 3.46% Pb and 0.14% Cu) over 166m including 1,092 g Ag eq/t (446 g Ag/t, 9.03% Pb and 1.16% Sn) over 56.19m. The west end of the adit intersects the end of the SBBP.
Since the initial discovery hole, Eloro has released a number of significant drill results in the SBBP and the surrounding mineralized envelope which along with geophysical data has defined an extensive target zone. In its September 20, 2022 press release, the Company reported that new downhole geophysical data has significantly extended the strike length of the high-grade feeder zone at Santa Barbara a further 250m along strike to the south-southeast from existing drilling. The 3D inverse magnetic model which correlates very strongly with the conductive zone suggested that the high-grade feeder zone may extend across the entire caldera for as much as a further 1 km along strike for a total potential strike length of at least 2 km. As reported, the definition drill program was modified to sectionally drill this potential extension with the intention of defining a major open pittable deposit in the valley of the caldera. As a result, the estimated completion date for the maiden National Instrument 43-101 mineral resource was pushed back to the end of Q1 2023.
The Company completed 84,495m of drilling in 122 holes from the definition drill program in the Santa Barbara target area, as previously announced on November 27, 2022.
On November 22, 2022, Eloro announced the acquisition of the Mina Casiterita and Mina Hoyada properties covering 14.75 km2 southwest and west of Iska Iska. These properties connect with the TUP-3 and TUP-6 claims previously staked by Eloro. Eloro has also staked additional land in the area. Following the acquisition, the total land package in the Iska Iska area to be controlled by Eloro will total 1,935 quadrants covering 483.75 km2.
Artisanal mining in the 1960’s identified high grade tin (Sn) veins on the Mina Casiterita property that are hosted in an intrusive dacite. Production from 1962 to 1964 is reported by the Departamento Nacional de Geología in Bolivia to be 69.85 tonnes grading 50.60% Sn.
Recently completed magnetic surveys by Eloro has outlined an extensive, near surface, magnetic intrusive body on the Mina Casiterita property immediately southwest of Iska Iska. This intrusive hosts the previously mined high-grade tin veins and is very likely the continuation of the porphyry tin intrusion projected to be below the epithermal Ag-Sn-Zn-Pb mineralization at Iska Iska.
The Porco adit from which previously reported channel sampling returned 103m grading 521 g Ag eq/t (including g 117g Ag/t, 1.44 g Au/t, 0.54% Cu and 0.66% Sn) in altered basement sediments, is located near the northeast part of the magnetic anomaly, attesting to the potential strength and high-grade nature of the mineralized system in the area.
Drilling is planned in the Porco area and on Mina Casiterita commencing in early February 2023 with geological mapping, sampling and geophysical surveys now in progress on the full land package across the Iska Iska region.
About Eloro Resources Ltd.
Eloro is an exploration and mine development company with a portfolio of gold and base-metal properties in Bolivia, Peru and Quebec. Eloro has an option to acquire a 100% interest in the highly prospective Iska Iska Property, which can be classified as a polymetallic epithermal-porphyry complex, a significant mineral deposit type in the Potosi Department, in southern Bolivia. A recent NI 43-101 Technical Report on Iska Iska, which was completed by Micon International Limited, is available on Eloro’s website and under its filings on SEDAR. Iska Iska is a road-accessible, royalty-free property. Eloro also owns an 82% interest in the La Victoria Gold/Silver Project, located in the North-Central Mineral Belt of Peru some 50 km south of Barrick’s Lagunas Norte Gold Mine and Pan American Silver’s La Arena Gold Mine.
For further information please contact either Thomas G. Larsen, Chairman and CEO or Jorge Estepa, Vice-President at (416) 868-9168.
Information in this news release may contain forward-looking information. Statements containing forward-looking information express, as at the date of this news release, the Company’s plans, estimates, forecasts, projections, expectations, or beliefs as to future events or results and are believed to be reasonable based on information currently available to the Company. There can be no assurance that forward-looking statements will prove to be accurate. Actual results and future events could differ materially from those anticipated in such statements. Readers should not place undue reliance on forward-looking information.
Neither the TSXV nor its Regulation Services Provider (as that term is defined in the policies of the TSXV) accepts responsibility for the adequacy or accuracy of this release.
Figures accompanying this announcement are available at:
https://www.globenewswire.com/NewsRoom/AttachmentNg/9ce30823-fe4c-4f72-a3d8-929e6570e0b3
https://www.globenewswire.com/NewsRoom/AttachmentNg/455df381-6439-40b5-bf6a-b9af4235468c
https://www.globenewswire.com/NewsRoom/AttachmentNg/3c1d7522-6763-472d-b75a-54cd9233254d
Clean Air Metals: Royalty, Not Equity
One of the challenges in the junior resource exploration/development sector is attaching a credible net asset value to potential assets in the ground. A 43-101 resource estimate is helpful, so is a preliminary economic assessment; but neither really attaches a hard cash value to a company’s project.
Which is why Abraham Drost, CEO of Clean Air Metals (AIR.V) was delighted with the sale of a 2.5% net smelter returns mining royalty for all mineral products produced on the Thunder Bay North Critical Minerals (Platinum, Palladium, Copper, Nickel) Project in Northern Ontario, Canada.
“Triple Flag Precious Metals Corp. is paying us what will be 15 million dollars for a 2.5% net smelter return royalty on our Thunder Bay Critical Minerals Project,” said Drost. “These were orphaned assets which we paid 15 million dollars for 100% of title two years ago. We jumped in with both feet and we’ve put a further $30 million into the ground since then.”
“The value of the Current Deposit and Escape Deposit assets and the work done is not yet reflected in Clean Air’s share price,” said Drost. “However, the Triple Flag investment was into the asset not the equity. If we had gone the equity route to finance 15 million dollars we would have had to issue 60% of our float.”
Drost has lots to say about the flow through share, tax-driven, nature of junior resource financing in Canada. But his takeaway was, “Triple Flag are royalty investors that believe in the potential production value of the assets.”
“Now we are funded to delivery of a pre-feasibility study technical report and additional drilling. Our exploration work will be looking at six, ultra low resistivity, electromagnetic targets outside the known magma conduits. The lower the resistivity the higher the conductivity and that indicates metal.”
With what they have seen so far, Clean Air envisions two mines feeding a single mill. “But there maybe a third deposit, time will tell” said Drost.
Clean Air has attracted a good deal of industry attention. “We had seven parties in the data room,” said Drost. “The CEO of Triple Flag is an ex-colleague of our Chairman, Jim Gallagher and COO Mike Garbutt at Falconbridge and XStrata. Triple Flag has made its bet on the assets and the jockeys.”
In the news release, Gallagher states: “This sizeable, early-stage investment by Triple Flag made after a significant due diligence review demonstrates the inherent potential value of the Thunder Bay North Critical Minerals Project. We appreciate Triple Flag’s confidence in the Clean Air Metals team’s ability to engineer, permit and construct a mine at Thunder Bay North.”
The jockeys in Clean Air’s case bring a wealth of mining engineering and exploration experience to their orphaned deposits. Jim Gallagher has been a mining engineer and mine operator for 35 years. Most recently he “turned around” and sold North American Palladium. Abraham Drost is a professional geologist with a 35 year career leading junior exploration and development companies.
From the investor perspective, Clean Air trading at $0.12 is very much worth a look now that it is funded to the pre-feasibility stage. Triple Flag is not investing to lose money so, rather obviously, their due diligence suggested a highly economic potential producer. Critically, selling the royalty instrument means that Clean Air will not be returning to the capital markets to raise money any time soon.
The great enemy of the retail investor is the share dilution companies have to undertake to raise capital to advance their projects. Clean Air’s management is committed to avoiding that dilution which means there will not be more shares issued at knock down prices. As the Thunder Bay North project advances the markets will have the opportunity to re-rate Clean Air’s share price as it moves from exploration to development.
The overall junior resource market is battered. Market caps are in no way reflective of the underlying value of the assets a company controls or the work it has undertaken.
“Up until now we’ve been price takers,” said Drost. “Now we aren’t.”
It is a very good place to be.
Clean Air Metals appoints BBA as Prime Engineering Consultant for Prefeasibility Study of the Thunder Bay North Critical Minerals Project and Provides Corporate Update
Clean Air Metals Inc. (“Clean Air Metals” or the “Company”) (TSXV: AIR) (OTCQB: CLRMF) (FRA: CKU) is pleased to announce that Sudbury and Montreal-based BBA E&C Inc. (“BBA”) has been selected as the prime engineering consultant to lead the execution of the remaining Pre-Feasibility Study (PFS) work packages on the Thunder Bay North Critical Minerals Project.
The work package will include the overall underground mine design, optimized life-of-mine planning, dilution estimation, mining selectivity and cut-off policy optimization, mining value chain optimization (“mine-to-mill”), estimation of proven and probable (2P) mineral reserves and reporting according to NI 43-101 requirements. In keeping with Clean Air Metals’ objective in seeking net-zero carbon neutrality at Thunder Bay North, BBA will conduct trade-off studies around conventional mine fleet, trolley-electric and battery-electric vehicles (BEV) as well as site infrastructure design, tailings management solutions and provide overall cost estimation.
DRA Americas continues with the metallurgical optimization work that was started in May 2022 (see press release dated May 26, 2022). It is expected that the metallurgical test program will be completed in Q1 2023 with the mill flowsheet and plant design phase commencing immediately and continuing into Q2 2023. Completion of the entire Prefeasibility Study is expected in Q3 2023.
Clean Air Metals has engaged SLR Consulting to complete a validation of in-house resource estimates that were generated for the Current and Escape deposits within the Thunder Bay North Project (see press release dated August 2, 2022). The Corporation intends to use the validated mineral resource estimate will be used for the basis of a standalone technical report authored by SLR with a target release in Q1 2023. It is expected that the updated mineral resource estimate will be the foundation for the mine planning in the PFS technical report.
Carbon capture and carbon sequestration are becoming more relevant to all industries as society strives to a net zero impact to the environment. Carbon capture is the trapping of carbon emissions after they have been emitted but before they enter the atmosphere. Carbon sequestration is the storage of removed or captured carbon in various environmental reservoirs.
The carbon sequestration potential of ultramafic mine tailings has been recognized previously at multiple operations. Mining operations that produce ultramafic rock tailings have the potential advantage of sequestering CO2 into the waste material. Carbon sequestration into exposed tailings has a two-fold benefit; 1) reducing carbon foot print associated with the mining process through CO2 sequestration and 2) potential stabilization of tailings by the formation of secondary magnesium carbonate minerals that can act as a cement within the tailings after they are deposited.
Clean Air Metals has initiated a number of studies, including specialty testing at world-class research facilities, to better understand the carbon sequestration potential of the waste rock and mill processing tails at Thunder Bay North. A Master of Science research project at Lakehead University is looking at the effects of hydrothermal alteration on the mineralized ultramafic rocks and characterizing the magnesium alteration products to identify potential reactive mineral species. Results to date show that the ultramafic and mafic rock units and minerals at Thunder Bay North successfully capture and sequester CO2 gas from the atmosphere.
Abraham Drost, Chief Executive Officer of Clean Air Metals, commented: “planned 2023 project milestones include a mineral resource update in Q2 2023 and delivery of a prefeasibility study and 2P mineable reserves in Q3 2023. The Company has a long-term commitment to development of an environmentally sustainable mining operation at Thunder Bay North. It is well financed for the next chapter of that journey having recently closed the first tranche of a C$15 million mining royalty investment into the Thunder Bay North Platinum-Palladium-Copper-Nickel project by Triple Flag Precious Metals Corp.” (See press release dated December 19, 2022).
Clean Air Metals Inc. and its wholly-owned subsidiary Panoramic PGMs (Canada) Ltd. acknowledge that the Thunder Bay North Critical Minerals Project is on the traditional territories of the Fort William First Nation, Red Rock Indian Band and Biinjitiwabik Zaaging Anishinabek. The parties together are the Cooperating Participants in a Memorandum of Agreement dated January 9, 2021 (press release January 11, 2021) and Exploration Agreement signed April 13, 2022 (press release April 14, 2022).
The Company appreciates the opportunity to work in these territories and remains committed to the recognition and respect of those who have lived, traveled, and gathered on the lands since time immemorial. Clean Air Metals is committed to stewarding Indigenous heritage and remains committed to building, fostering and encouraging a respectful relationship with First Nations and Métis peoples based upon principles of mutual trust, respect, reciprocity and collaboration in the spirit of reconciliation.
Clean Air Metals’ flagship asset is the 100% owned, high grade Thunder Bay North Project, a platinum, palladium, copper, nickel project located near the City of Thunder Bay, Ontario and the Lac des Iles Mine owned by Impala Platinum. The Thunder Bay North Project hosts the twin magma conduit bodies which host the Current and Escape deposits forming the basis for a robust preliminary economic assessment (PEA) filed January 12, 2022. The PEA of a ramp access underground mine and on-site 3600 tpd milling complex and the 2-year trailing average price deck delivers an NPV5 NAV of $425m in fully discounted cash flows, a pre-tax IRR of 31% and a post-tax IRR of 25% on initial capital of $367 million.
Executive Chair Jim Gallagher, P.Eng. and COO Mike Garbutt, P.Eng. lead an experienced technical team who are using the Norilsk magma conduit stratigraphic and mineral deposit model to guide ongoing exploration and development prefeasibility studies for a low-carbon, all-electric sustainable mining operation at Thunder Bay North. As the former CEO of North American Palladium Ltd. which owned the Lac des Iles Mine prior to the sale to Impala Platinum in December 2019, Jim Gallagher and team are credited with the mine turnaround and creation of significant value for shareholders.
Website: www.cleanairmetals.ca
Neither TSX Venture Exchange nor its Regulation Services Provider (as that term is defined in the policies of the TSX Venture Exchange) accepts responsibility for the adequacy or accuracy of this release.
The information contained herein contains “forward-looking statements” within the meaning of applicable securities legislation. Forward-looking statements relate to information that is based on assumptions of management, forecasts of future results, and estimates of amounts not yet determinable. Any statements that express predictions, expectations, beliefs, plans, projections, objectives, assumptions or future events or performance are not statements of historical fact and may be “forward-looking statements.” Forward-looking statements in this press release include statements related to timing and results of the technical studies including the delivery of a prefeasibility study and 2P mineable reserves in Q3 2023 which are subject to a variety of risks and uncertainties which could cause actual events or results to differ from those reflected in the forward-looking statements, including, without limitation: risks related to the failure to obtain adequate financing on a timely basis and on acceptable terms; risks related to the outcome of legal proceedings; political and regulatory risks associated with mining and exploration; risks related to the maintenance of stock exchange listings; risks related to environmental regulation and liability; the potential for delays in exploration or development activities or the completion of feasibility studies; the uncertainty of profitability; risks and uncertainties relating to the interpretation of drill results, the geology, grade and continuity of mineral deposits; risks related to the inherent uncertainty of production and cost estimates and the potential for unexpected costs and expenses; results of prefeasibility and feasibility studies, and the possibility that future exploration, development or mining results will not be consistent with the Company’s expectations; risks related to commodity price fluctuations; and other risks and uncertainties related to the Company’s prospects, properties and business detailed elsewhere in the Company’s disclosure record. Should one or more of these risks and uncertainties materialize, or should underlying assumptions prove incorrect, actual results may vary materially from those described in forward-looking statements. Investors are cautioned against attributing undue certainty to forward-looking statements. These forward-looking statements are made as of the date hereof and the Company does not assume any obligation to update or revise them to reflect new events or circumstances, except in accordance with applicable securities laws. Actual events or results could differ materially from the Company’s expectations or projections.
SOURCE Clean Air Metals Inc.
For further information: Abraham Drost, M.Sc. P.Geo., Chief Executive Officer, Clean Air Metals Inc., Phone: 807-252-7800, Email: adrost@cleanairmetals.ca
Clean Air Metals Files Q3/22 Interim Financial Statements
Clean Air Metals Inc. (“Clean Air Metals” or the “Company“) (TSXV: AIR) (FRA: CKU) (OTCQB: CLRMF) announces that it has filed its unaudited consolidated interim financial statements and management’s discussion and analysis for the nine-month period ended October 31, 2022, available for viewing on www.sedar.com.
- Total assets as at October 31, 2022 of $42,279,897
- Total cash as at October 31, 2022 of $903,741
- Working capital deficiency as at October 31, 2022 of $472,891
- Shareholder’s equity as at October 31, 2022 of $40,281,883
During the three-month period ended October 31, 2022 as previously reported, the Company:
- Completed a total of 11 holes on the Current Deposit for a cumulative total of 2,564m of drilling.
- Continued prefeasibility studies and environmental baseline studies for the Thunder Bay North Critical Minerals Project under the supervision of Mr. Mike Garbutt, P.Eng. MBA, Chief Operating Officer and Mr. Kris Tuuttila, Director of Permitting, Sustainability and Community Relations.
- Appointed SLR Consulting Limited (“SLR”) to provide external validation of an internal mineral resource update of the Escape Deposit, including the addition of 55,651m of previously reported 2021/22 drilling results.
Financial Summary
For the three months ended | For the nine months ended | |||
October 31, 2022 | October 31, 2021 | October 31, 2022 | October 31, 2021 | |
Operating Expenses | $ 1,244,247 | $ 1,056,915 | $ 3,352,677 | $ 3,045,788 |
Net Loss and Comprehensive Loss | (1,149,336) | (43,617) | (2,456,850) | (885,959) |
Loss per share – | ||||
Basic and Diluted | $ (0.01) | $ (0.00) | $ (0.01) | $ (0.01) |
October 31, 2022 | January 31, 2022 | |||
Total Assets | $ 42,279,897 | $ 35,059,465 | ||
Total Liabilities | 1,988,014 | 4,027,436 | ||
Total Shareholders’ Equity | $ 40,281,883 | $ 31,032,029 | ||
Full details of the financial reports and operating results for the nine-month period ended October 31, 2022 are described in the Company’s unaudited consolidated interim financial statements with accompanying notes and related Management’s Discussion and Analysis, available on SEDAR at www.sedar.com.
Qualified Person
Dr. Geoff Heggie, Ph.D., P.Geo., a Qualified Person under National Instrument 43-101 and Vice President – Exploration for the Company, has reviewed and approved all technical information in this press release.
Social Engagement
Clean Air Metals Inc. and its wholly-owned subsidiary Panoramic PGMs (Canada) Ltd. acknowledge that the Thunder Bay North Critical Minerals Project is on the traditional territories of the Fort William First Nation, Red Rock Indian Band and Biinjitiwabik Zaaging Anishinabek. The parties together are the Cooperating Participants in a Memorandum of Agreement dated January 9, 2021 (press release January 11, 2021) and Exploration Agreement signed April 13, 2022 (press release April 14, 2022).
The Company appreciates the opportunity to work in these territories and remains committed to the recognition and respect of those who have lived, traveled, and gathered on the lands since time immemorial. Clean Air Metals is committed to stewarding Indigenous heritage and remains committed to building, fostering and encouraging a respectful relationship with First Nations and Métis peoples based upon principles of mutual trust, respect, reciprocity and collaboration in the spirit of reconciliation.
Clean Air Metals’ flagship asset is the 100% owned, high grade Thunder Bay North Project, a platinum, palladium, copper, nickel project located near the City of Thunder Bay, Ontario and the Lac des Iles Mine owned by Impala Platinum. The Thunder Bay North Project hosts the twin magma conduit bodies which host the Current and Escape deposits forming the basis for a robust preliminary economic assessment PEA) filed January 12, 2022. The PEA of a ramp access underground mine and on-site 3600tpd milling complex and the 2-year trailing average price deck, features a pretax NPV5 of C$425m and an IRR of 31% on initial capital of $378m over a 10-year mine life.
Executive Chair Jim Gallagher and CEO Abraham Drost lead an experienced technical team who are using the Norilsk magma conduit stratigraphic and mineral deposit model to guide ongoing exploration and development and prefeasibility technical studies for a low-carbon, all-electric sustainable mining operation at Thunder Bay North. As the former CEO of North American Palladium Ltd. which owned the Lac des Iles Mine prior to the sale to Impala Platinum in December 2019, Jim Gallagher and team are credited with the mine turnaround and creation of significant value for shareholders.
ON BEHALF OF THE BOARD OF DIRECTORS
“Abraham Drost”
Abraham Drost, Chief Executive Officer of Clean Air Metals Inc.
Neither the TSX Venture Exchange nor its Regulation Services Provider (as that term is defined in policies of the TSX Venture Exchange) accepts responsibility for the adequacy or accuracy of this release.
The information contained herein contains “forward-looking statements” within the meaning of applicable securities legislation. Forward-looking statements relate to information that is based on assumptions of management, forecasts of future results, and estimates of amounts not yet determinable. Any statements that express predictions, expectations, beliefs, plans, projections, objectives, assumptions or future events or performance are not statements of historical fact and may be “forward-looking statements.” Forward-looking statements are subject to a variety of risks and uncertainties which could cause actual events or results to differ from those reflected in the forward-looking statements, including, without limitation: political and regulatory risks associated with mining and exploration; risks related to the maintenance of stock exchange listings; risks related to environmental regulation and liability; the potential for delays in exploration or development activities or the completion of feasibility studies; the uncertainty of profitability; risks and uncertainties relating to the interpretation of drill results, the geology, grade and continuity of mineral deposits; risks related to the inherent uncertainty of production and cost estimates and the potential for unexpected costs and expenses; results of prefeasibility and feasibility studies, and the possibility that future exploration, development or mining results will not be consistent with the Company’s expectations; risks related to commodity price fluctuations; and other risks and uncertainties related to the Company’s prospects, properties and business detailed elsewhere in the Company’s disclosure record. Should one or more of these risks and uncertainties materialize, or should underlying assumptions prove incorrect, actual results may vary materially from those described in forward-looking statements. Investors are cautioned against attributing undue certainty to forward-looking statements. These forward-looking statements are made as of the date hereof and the Company does not assume any obligation to update or revise them to reflect new events or circumstances, except in accordance with applicable securities laws. Actual events or results could differ materially from the Company’s expectations or projections.
SOURCE Clean Air Metals Inc.
For further information: Abraham Drost, Chief Executive Officer of Clean Air Metals Inc., Phone: 807-252-7800, Email: adrost@cleanairmetals.ca, Website: www.cleanairmetals.ca